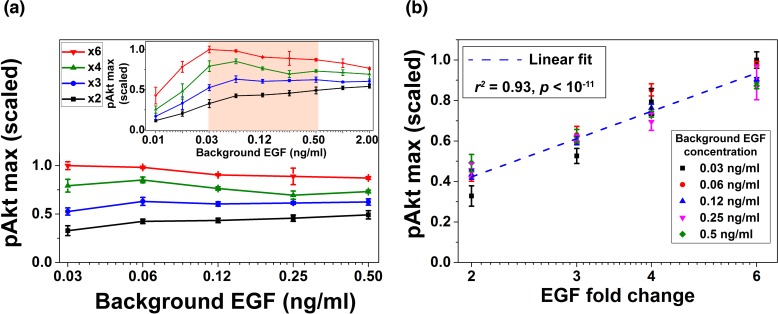
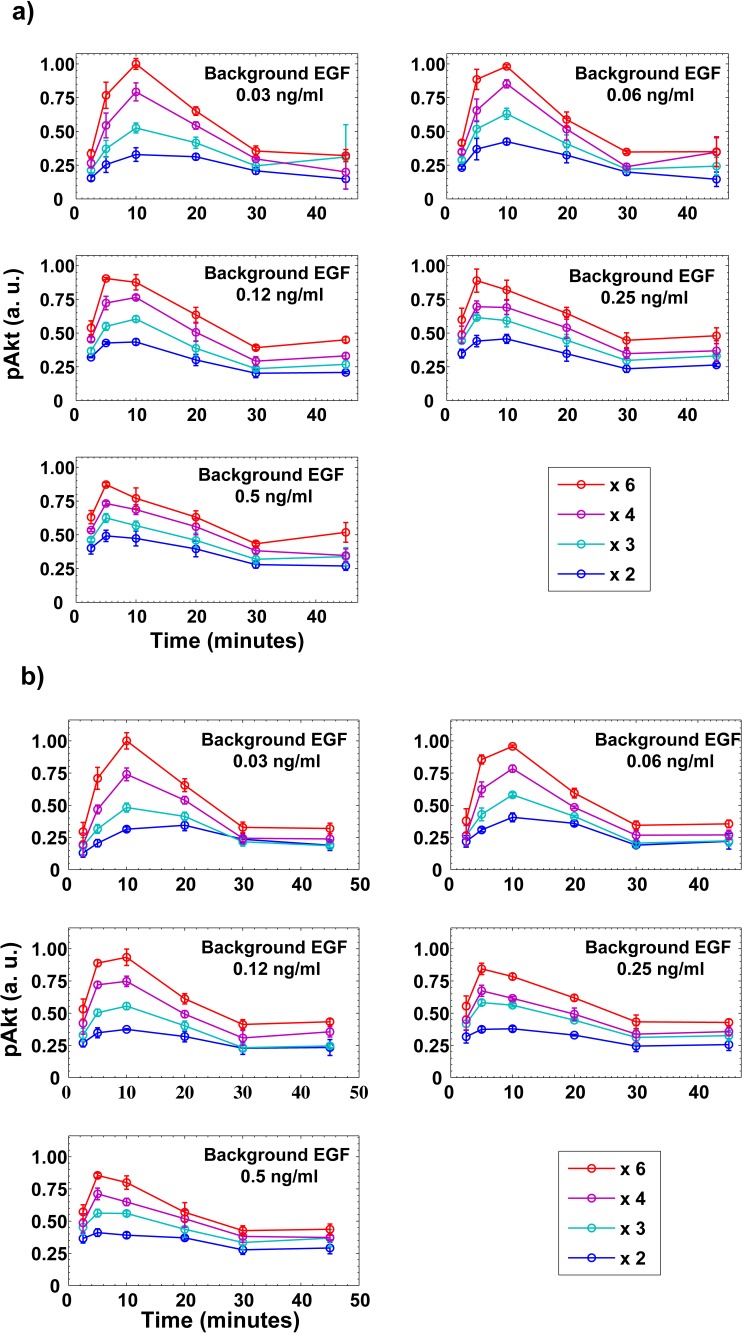
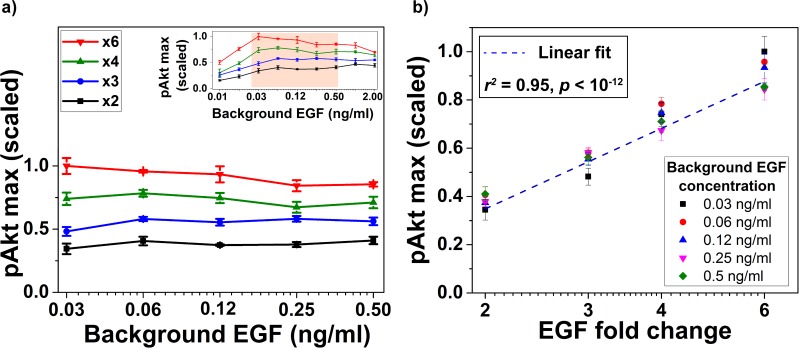
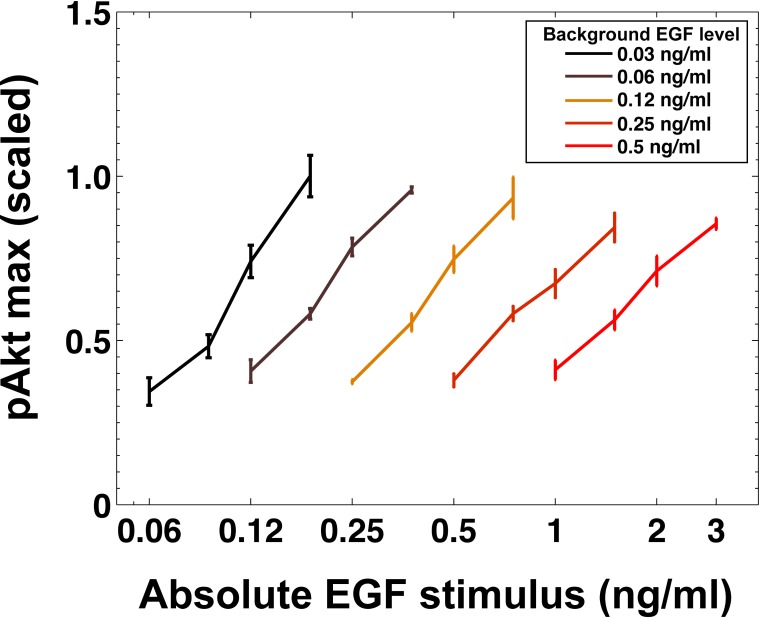
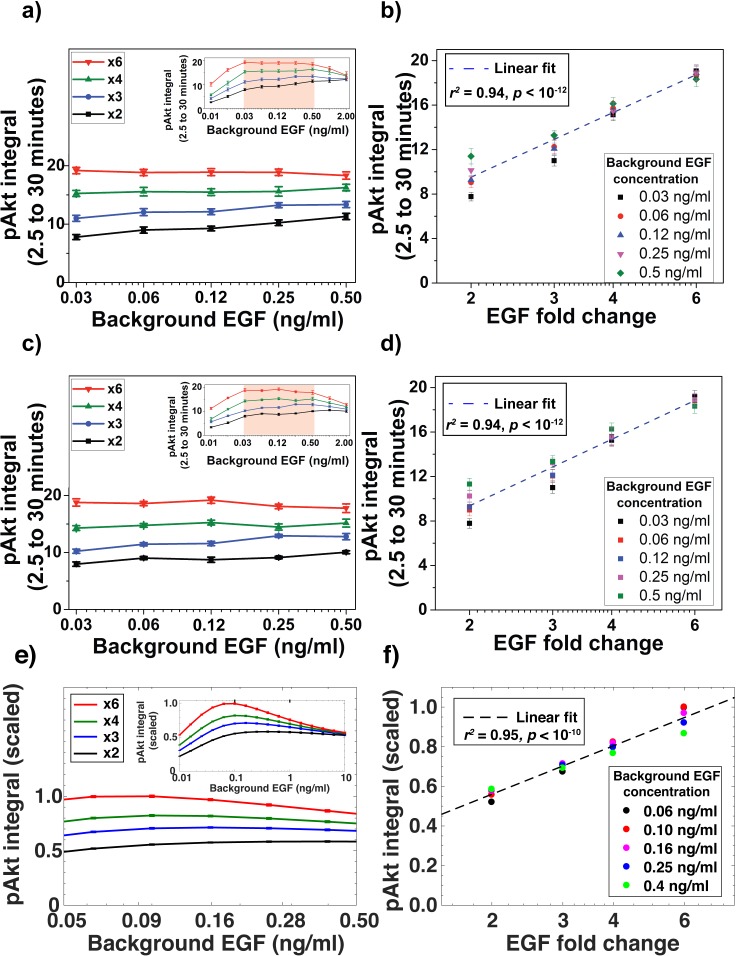
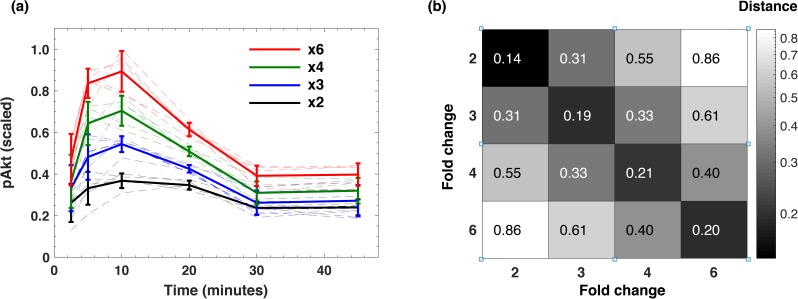
Figure 3. Experimental validation of EGF relative sensing by pAkt in MCF10A cells.
(a) The maximal pAkt responses after exposing cells to different background EGF levels (x axis) for 3 hr, followed by 2-, 3-, 4-, and 6-fold increases (different colors) in EGF. Inset shows experimental pAkt response over a wider range of background EGF levels. (b) Maximal pAkt responses (y axis) to fold changes in EGF depended approximately logarithmically on the fold change. Maximal pAkt responses induced by stimulation with various EGF background levels (data points with the same shape and color) were combined and plotted as a function of the EGF fold change (x axis). Dashed line represents log-linear fit to the data (Pearson’s r2 = 0.93, regression p value < 10−11). In all subpanels, error bars represent the standard deviation of n = 3 technical replicates. Source data: expt_data.mat (available in Source code 1).

