. 2020 Jan 21;9:e50342. doi: 10.7554/eLife.50342

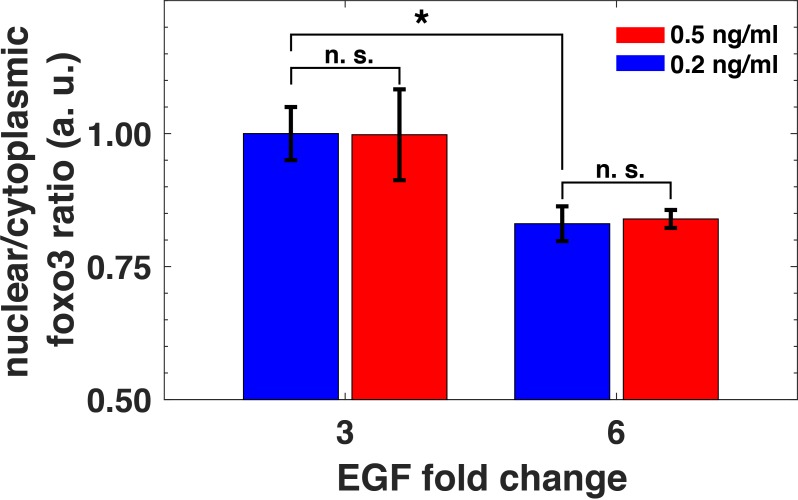
Figure 7. Relative sensing of EGF concentrations by pAkt is propagated to FoxO3.

MCF10A cells were first exposed to two background concentrations of EGF for three hours, and then were stimulated with 3- and 6- fold increase in EGF concentrations. The ratio of nuclear-to-cytoplasmic FoxO3 levels (y-axis) was measured using quantitative immunofluorescence (Materials and methods) after 15 min of the EGF fold changes. Statistical significance was calculated using the Wilcoxon rank sum test (n = 5); * corresponds to p<0.01, and n. s. corresponds to p>0.1. Error bars represent the standard deviation of n = 5 technical replicates. Source data: expt_data.mat (available in Source code 1).

Figure 7.

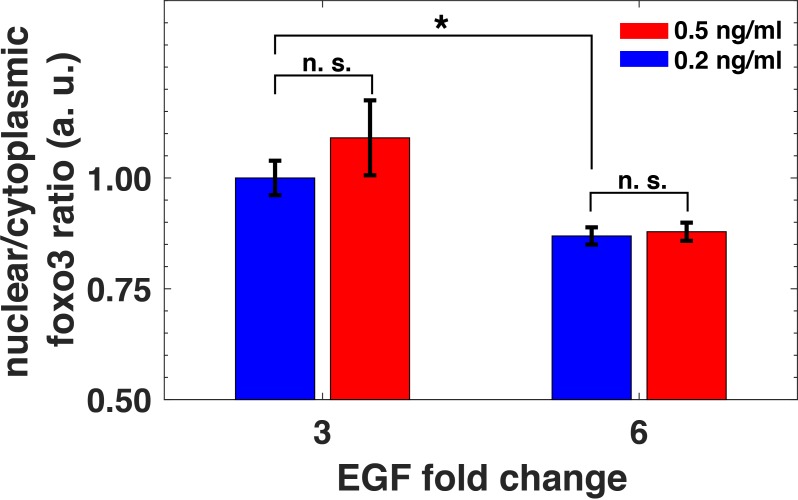
Figure 7—figure supplement 1. Biological replicate of the experiment showing relative sensing of EGF by FoxO3.

Figure 7—figure supplement 1.

MCF10A cells were first exposed to two background concentrations of EGF for 3 hr, and then were stimulated with 3- and 6- fold increase in EGF concentration. The ratio of nuclear to cytoplasmic FoxO3 levels (y-axis), measured 15 min after the EGF fold changes, depended on the relative but not absolute change of EGF concentration. Statistical significance was calculated using the Wilcoxon rank sum test (n = 5); n. s. corresponds to p>0.1, and * corresponds to p<0.01. Error bars represent the standard deviation of n = 5 technical replicates.