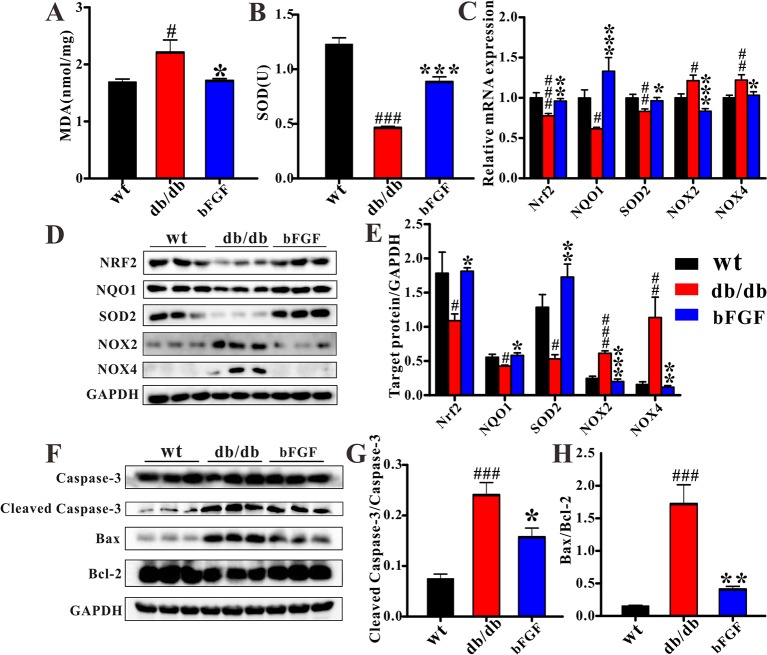
Figure 7.
bFGF suppressed oxidative stress and apoptosis in kidney of db/db mice. The levels of (A) MDA and (B) SOD in renal tissues of wild-type (wt), db/db, and bFGF-treated mice. (C) The relative mRNA expression of Nrf2, NQO1, SOD2, NOX2, and NOX4 in renal tissues of wt, db/db, and bFGF-treated mice. (D) Western blot analysis of Nrf2, NQO1, SOD2, NOX2, and NOX4 in renal tissues of wt, db/db, and bFGF-treated mice. (E) Intensities of Nrf2, NQO1, SOD2, NOX2, and NOX4 normalized to GADPH. (F) Western blot analysis of caspase-3, cleaved caspase-3, Bax, and Bcl-2 in renal tissues of wt, db/db, and bFGF-treated mice. (G) Intensities of cleaved caspase-3 normalized to caspase-3. (H) Intensities of Bax normalized to Bcl-2. Significant level: # P < 0.05, ## P < 0.01, and ### P < 0.001 versus wt mice; *P < 0.05, **P < 0.01, and ***P < 0.001 versus db/db mice.

