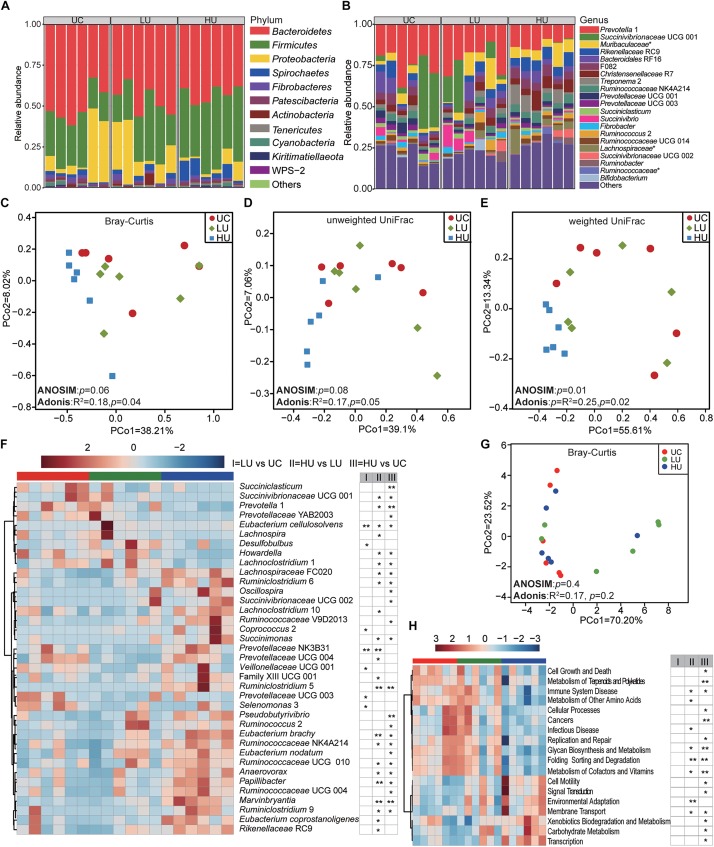
FIGURE 3.
Bacterial community compositions and potential function in the rumen liquid fractions under the three treatments. Box plots showing the bacterial community compositions in the rumen liquid fractions of the UC, LU, and HU treatments at the phylum (A) and genus (B) levels. PCoA based on Bray–Curtis dissimilarity matrix (C), unweighted UniFrac distance (D), and weighted UniFrac distance (E). Heatmap (F) showing differential taxa in the liquid fractions among the three treatments. PCoA (G) plot revealing differences in predicted microbial functions based on Bray–Curtis dissimilarity matrix. Heatmap (H) revealing the differences of the predictive function profiles at KEGG level 2 in the rumen solid fractions among the three treatments. * p < 0.05, ** p < 0.01. UC, basal diet with no urea; LU, basal diet supplemented with a low concentration of urea (10 g/kg DM); HU, basal diet supplemented with a high concentration of urea (30 g/kg DM).

