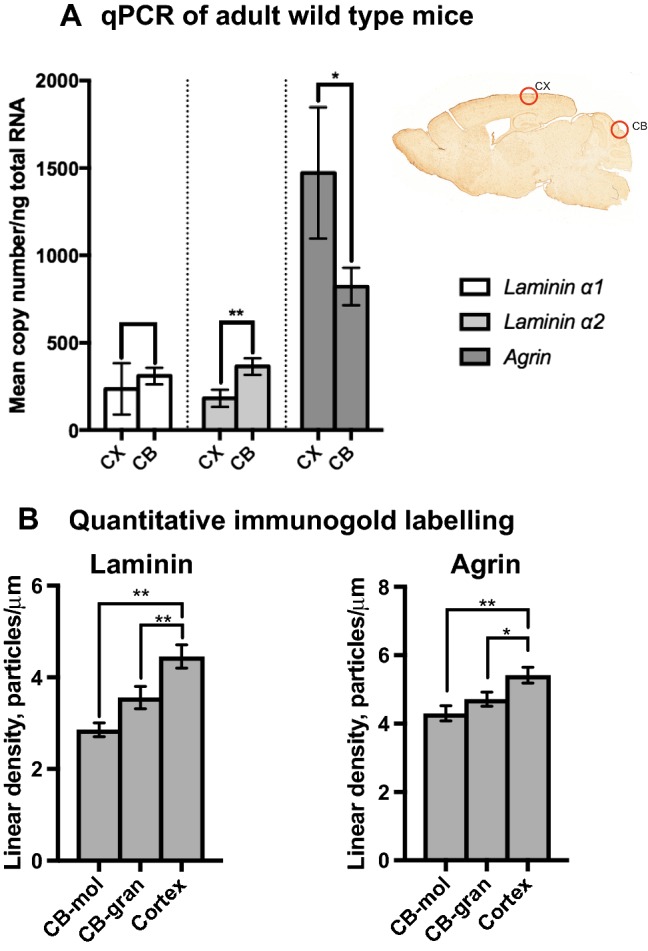
Fig. 2.

Evidence of regional heterogeneity of agrin and laminin is shown by quantitative RT-PCR (a) and immunogold labelling (b). Top right picture in a (right) shows dissected regions for PCR and embedded regions for electron microscopy. Graph a shows quantitative RT-PCR of ECM genes laminin (isoforms laminin α-1 and laminin α-2) and agrin in CX and CB from adult WT mice. All levels are reported as copy number/ng of total RNA. Levels of agrin mRNA are significantly higher (p = 0.015) in CX (mean 1471.91, SD 236.70) compared with CB (mean 821.81, SD 67.07). There is no significant difference (p = 0.238) between mRNA levels for laminin α-1 when comparing CX (mean 235.77, SD 92.54) with CB (mean 309.96, SD 30.08). Levels of laminin α-2 mRNA, however, are significantly (p < 0.001) higher in CB (mean 364.49; SD 29.89) compared with CX (mean 182.22; SD 31.41). Quantitative immunogold analysis of agrin (b, right) and laminin (b, left) in pericapillary basal laminae shows differences between brain regions. Using non-parametric Mann–Whitney U test, agrin levels in sublayers of the cerebellum, CB-mol (mean 4.3007; std error 0.21999) and CB-gran (mean 4.7148; std error 0.20698), show a statistically significant difference compared with those of CX (mean 5.4155; std error 0.22868), respectively p = 0.001 and p = 0.021. Laminin levels also vary across examined brain regions and subregions (left). Laminin levels in CX (mean 4.4523; std error 0.25444) are higher than in CB-mol (mean 2.8572; std error 0.14975) and CB-gran (mean 3.5607; std error 0.24393), respectively, p < 0.001 and p = 0.001. Error bars in a represent 95% confidence intervals calculated by bootstrapping. Error bars in b represent standard error of the mean (SEM). *p < 0.05, **p < 0.001
