Fig. 8.
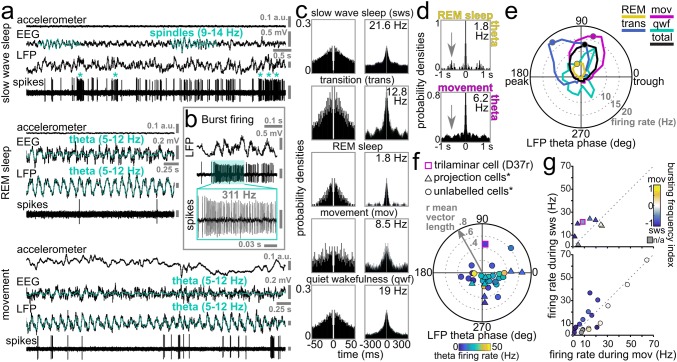
Behavioural state dependent activity of an identified trilaminar cell (D37r) in the rat hippocampal CA1 area. a Recording traces of the trilaminar cell activity during slow wave sleep (top) indicated by the occurrence of spindles (cyan) in the cortical EEG. Note irregular spiking with frequent bursts (asterisk) which switched to periodically regular firing with the emergence of theta oscillations (cyan) in both the hippocampal LFP and cortical EEG during REM sleep (middle) and movement (bottom). b A burst of action potentials at 311 Hz identifying trilaminar cells in the dorsal CA1. Such bursts lasting up to 200 ms occurred mostly during slow wave sleep and quiet wakefulness, likely associated with similarly high-frequency network events in the LFP e.g. SWRs. c Behavioural state-specific action potential autocorrelograms of the trilaminar cell show an early peak which resembles that of pyramidal cells firing complex spike bursts. Mean firing rates are reported in the top right corners. Note the decrease in firing rate of D37r between sleep and movement, the activity becoming minimal during REM. Time axes were limited to 50 ms (left) and 300 ms (right), bin width was set to 1 and 3 ms, respectively. d Action potential autocorrelograms during theta oscillations associated with REM sleep and movement demonstrating intermittent trilaminar cell activity skipping many cycles and discharging few action potentials per cycle. Note the peak (arrow) in the top autocorrelogram demonstrating an additional slow (1.7 Hz) modulation of trilaminar cell firing specifically during REM. Time axes were limited to 1 s and bin width was set to 10 ms. e Distribution of firing phases (colour-coded by behavioural states) and associated firing rates (dotted circles with grey numbers) of the labelled trilaminar cell during theta oscillations. Mean preferential theta phases (coloured dots) plotted only in episodes of significant coupling to theta cycles. Note strong tuning of the neuron along the ascending slope and the much lower firing rate during REM. f Preferred mean firing phase, strength of spike coupling to theta cycles (dotted circles along grey arrow) and mean firing rate during theta epochs (colour-coding of symbols) of the trilaminar cell together with other dCA1 long-range projecting GABAergic neurons (different symbols show neuron categorization). Note the strong coupling of the cell to the ascending slope of theta cycles, 180° out of phase from the majority of projection cells firing along the descending slope. g The firing rate of the trilaminar cell as of that of other dCA1 long-range projecting GABAergic neurons was higher during sleep than during movement (same symbols used as in f). Colour-coding represents changes in bursting frequency during sleep and movement. *Data from Katona et al. (2017) for comparison

