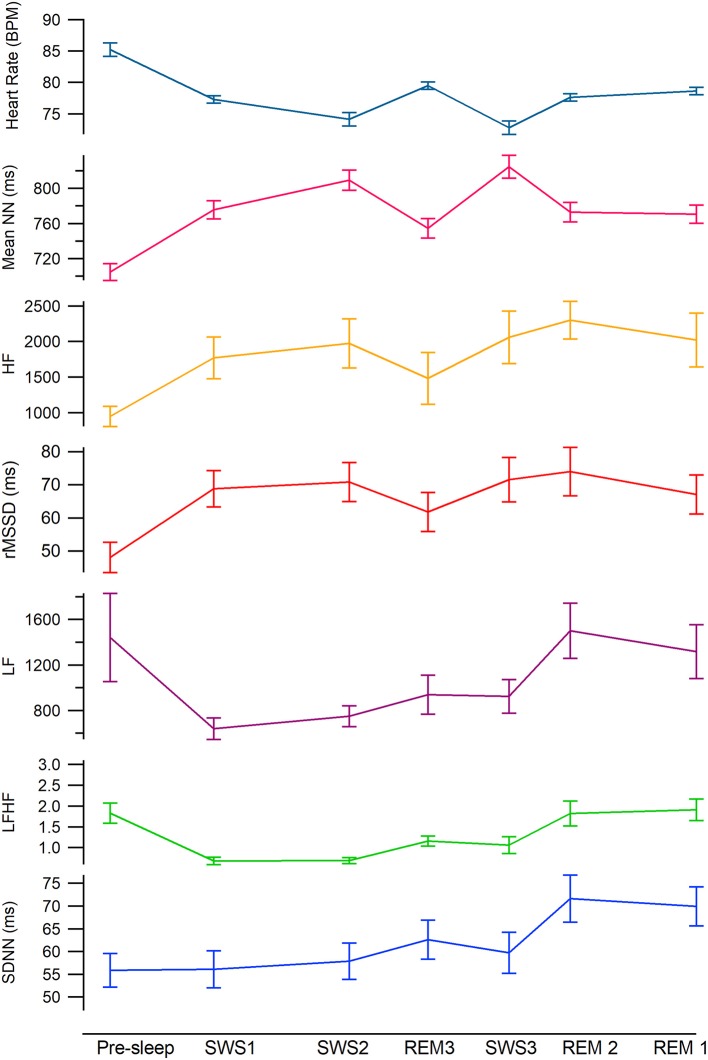
Figure 2.
Mean heart rate variability values across the night by sleep stage. From the top teal: heart rate, hot pink: meanNN, gold: HF, red: rMSSD, magenta: LF, green: LF:HF, blue: SDNN. Mean time of each epoch are as follows; Sleep onset, 2140 SWS1, 2258, SWS2, 2444, REM3, 0139, SWS3, 0240, REM2, 0326, REM1, 0501 (see Table 1 for time standard deviations).

