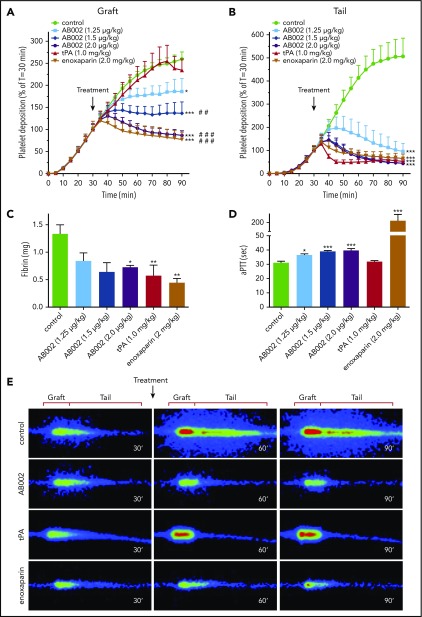
Figure 1.
AB002 interrupts thrombus formation in a primate thrombosis model. (A-B) Real-time platelet accumulation within collagen-coated synthetic vascular grafts (4-mm i.d.; 20 mm length) (A) and the tail region where the thrombus elongated distal to the graft (B). These devices were temporarily inserted into the femoral arteriovenous shunt of juvenile baboons. Blood flow through the device was adjusted to 100 mL/min, producing an initial shear rate of 265 s−1. Thrombi were allowed to grow for 30 minutes prior to intervention (black arrow). The average thrombus size at the time of intervention was set to 100%. Control experiments (n = 15) received no intervention or saline, whereas treatments were either tPA (n = 8) or increasing doses of E-WE thrombin (n = 4-7 per group). Posttreatment platelet accumulation was monitored for an additional 60 minutes. (C) Total fibrin deposition within the grafts was assessed at the end of each experiment. (D) aPTT was measured in platelet-poor plasma samples collected 10 minutes posttreatment. (E) Real-time γ-camera images of the developing thrombi taken at 30, 60, and 90 minutes. Images were recorded at 5-minute intervals and quantified in panels A and B. Each row of images shows representative images at each time point for control, AB002- (2 µg/mL), tPA-, and enoxaparin-treated baboons. Dimensions used to quantify graft and tail thrombus are indicated above each column. All data are expressed as mean plus or minus SEM. Asterisks denote significant differences to control (*P < .05; **P < .01; ***P < .001), pound symbols indicate significant differences to tPA (#P < .05; ##P < .01; ###P < .001). For panel B, all treatment groups, including tPA, are significantly different from control (P < .001), but not different from each other. Real-time platelet deposition was analyzed by 2-way ANOVA, and terminal fibrin and aPTT were analyzed using 1-way ANOVA.

