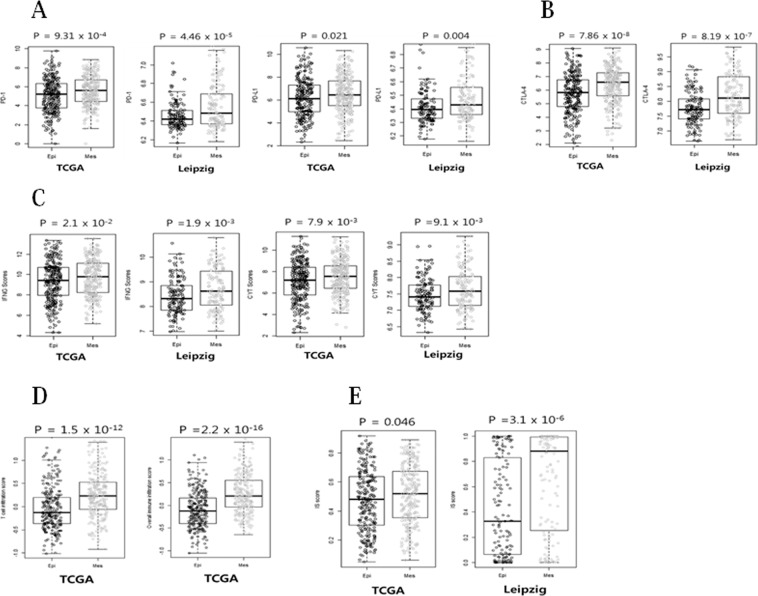
Figure 4.
Evidence of immune checkpoint molecules and immune scores in Mes compared with Epi subgroups of HNSCC. (A) PD-1 and PD-L1 levels were significantly elevated in Mes subgroup as compared with Epi subgroup in the TCGA and Leipzig cohorts. (B) CTLA-4 level was significantly higher in the Mes subgroup than that in the Epi subgroup in the TCGA and Leipzig cohorts. (C) The INFG and CYT scores were analyzed in the Mes subgroup in comparison with the Epi subgroup of HNSCC patients for gene expression data from the TCGA and Leipzig cohorts. (D) TIS and IIS were analyzed in the Mes subgroup in comparison with the Epi subgroup of HNSCC patients for gene expression data from the TCGA cohort. (E) The IS score was significantly elevated in Mes subgroup as compared with Epi subgroup in the TCGA and Leipzig cohorts.

