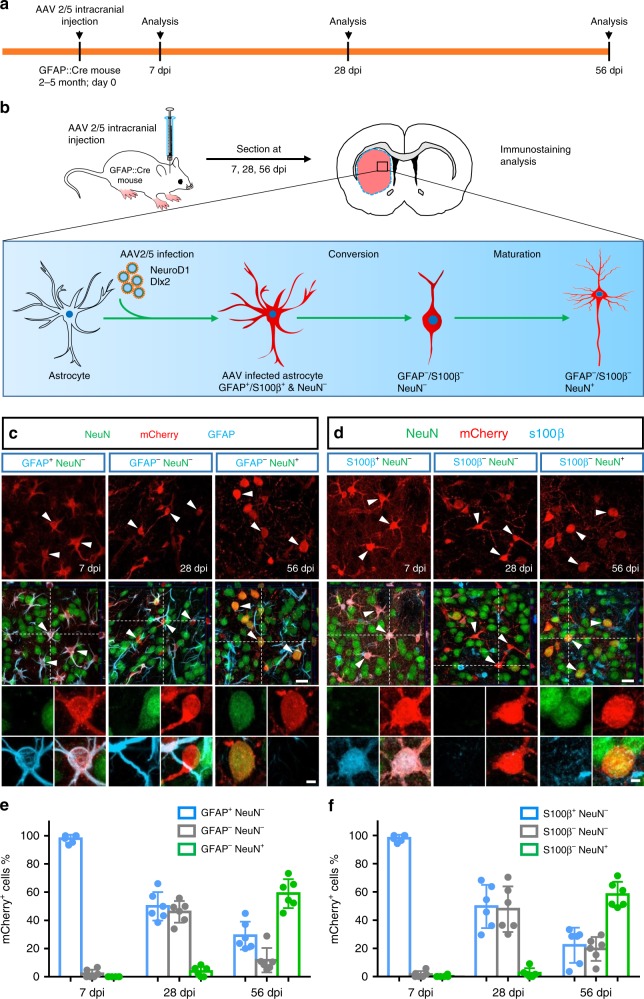
Fig. 3. Converted neurons originate from astrocytes traced by GFAP::Cre 77.6 transgenic mice.
a, b Experimental timeline (a) and schematic diagram (b) illustrating the use of GFAP::Cre reporter mice to investigate the astrocyte-to-neuron conversion process in the striatum induced by NeuroD1 + Dlx2 (FLEx-NeuroD1-P2A-mCherry and FLEx-Dlx2-P2A-mCherry). c Typical confocal images showing the mCherry+ cells (NeuroD1 + Dlx2) co-stained with GFAP and NeuN at 7 dpi (left column), 28 dpi (middle column), and 56 dpi (right column). Scale bar: 20 µm. Insets show a typical cell with different markers. Scale bar: 4 µm. d Confocal images of mCherry+ cells (NeuroD1 + Dlx2) co-stained with S100β and NeuN at 7, 28, and 56 dpi. Scale bar: 20 µm. Inset scale bar: 4 µm. e, f Quantified data showing a gradual transition from astrocytes to neurons over the time course of 2 months in the GFAP::Cre mice after injection of NeuroD1 and Dlx2 viruses. Note that besides a decrease of astrocytes and an increase of neurons among NeuroD1 and Dlx2-infected cells, about 40% of the infected cells were caught at a transitional stage at 28 dpi, which showed both GFAP-negative and NeuN-negative (e, gray bar) or both S100β-negative and NeuN-negative (f, gray bar). Also note that the time course of astrocyte-to-neuron conversion is slower in GFAP::Cre mice compared with that induced by GFAP::Cre AAV2/5, both in combination with AAV2/5 FLEx-NeuroD1-P2A-mCherry and FLEx-Dlx2-P2A-mCherry. Data are shown as mean ± SD.

