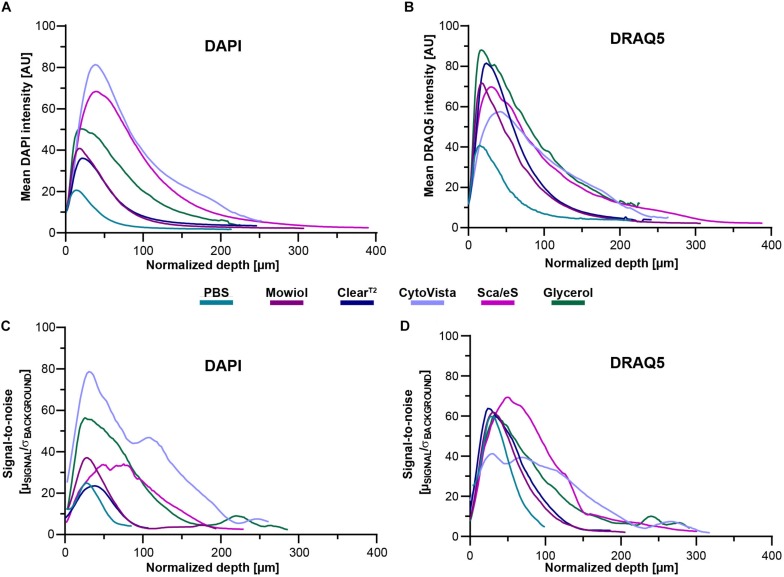
FIGURE 4.
Optical transparency, preservation of fluorescence signals and depth-dependent SNR are dependent on clearing method and cell line. Mono-culture spheroids of HaCaT cells were grown to approximately 300 μm diameter and then fixed. Upon staining of proliferating cells (anti-KI67) and nuclei (DAPI and DRAQ5), spheroids were embedded/cleared as indicated and then imaged in toto using confocal microscopy. Analysis of depth-dependent signal intensity of DAPI and DRAQ5 was performed by selecting one circular region of interest (ROI) per sample through the central region of the spheroid followed by mean intensity measurement throughout the entire stack depth. SNR values for DAPI and DRAQ5 were determined by measurement of mean intensity and standard deviation of background and nuclear signal via semi-automated thresholding. Then, SNR was calculated as the ratio of mean signal intensity in identified nuclear regions to the average standard deviation of background intensity (μSIGNAL/σBACKGROUND). To account for volume-changing effects of individual clearing methods, all depth values were normalized by the method-dependent degree of swelling or shrinkage. (A,B) Graphs show mean intensities of DAPI and DRAQ5 as a function of normalized z-depth HaCaT spheroids. (C,D) Graphs show mean SNR values for staining with DAPI and DRAQ5 as a function of normalized z-depth for HaCaT spheroids. All mean values were calculated from n ≥ 7 spheroids per condition.

