FIGURE 6.

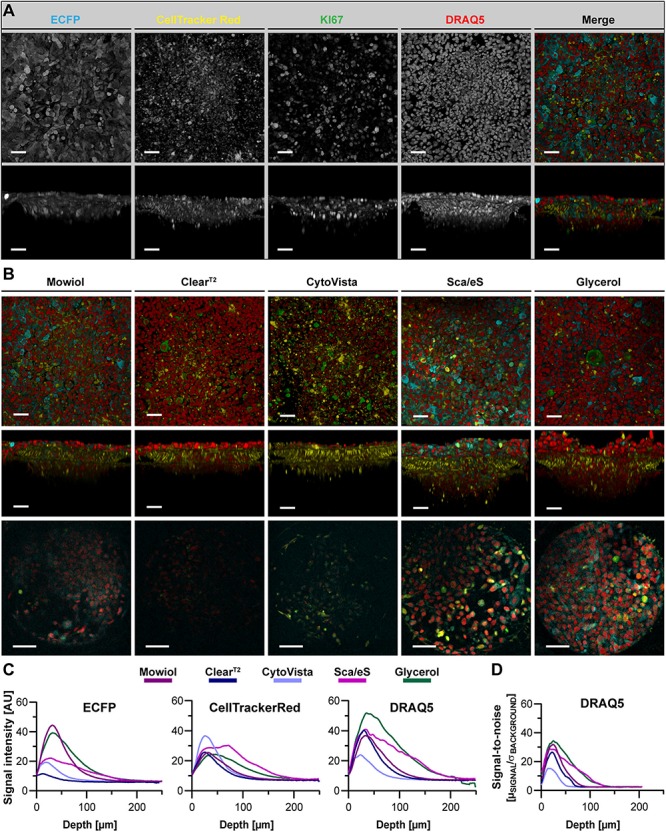
ECFP fluorescence is maintained by Glycerol-RI matching in a chip-based co-culture model of breast cancer cells and fibroblasts. ECFP-expressing MDA-MB-231 breast cancer cells were co-seeded with CellTracker Red labeled CCD-1337SK fibroblasts into Dynarray chips with 300 μm wide cavities. After 9 days of cultivation, chips were fixed, stained with anti-KI67 and DRAQ5, and then embedded or cleared as indicated. (A) Representative top and orthogonal 3D-volume projections of fluorescence signals (indicated) of Mowiol-embedded chip cavities are shown in upper and lower panels, respectively. In the merge, ECFP appears in cyan, CellTracker Red in yellow, KI67 in green, and DRAQ5 in red. Scale bars, 50 μm. (B) Depicted are representative images of chip cavities after different types of embedding/clearing as indicated. Top and side view maximum projections are shown in upper and middle panels. Lower panels show single optical sections at 75 μm of imaging depth. Scale bars, 50 μm in upper and middle row, 100 μm in lower row. (C,D) Quantitative analysis of mean signal intensity of ECFP, CellTracker Red, and DRAQ5 (C) and SNR of DRAQ5 signals (D) as a function of depth. Mean of n = 10 cavities per condition.
