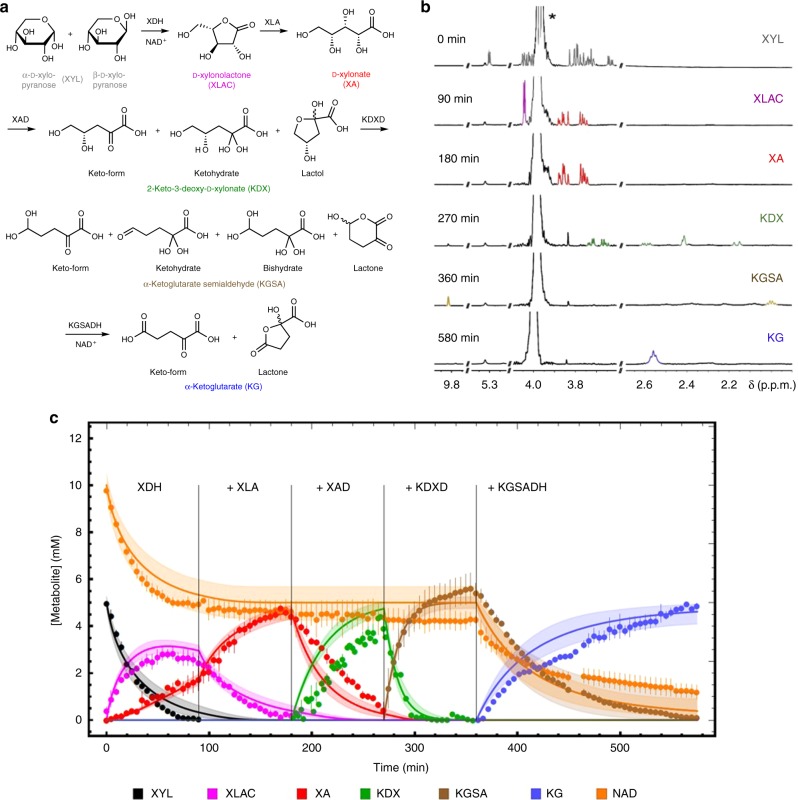
Fig. 2. Combined progress curves with single enzyme additions.
Conversion of d-xylose to α-ketoglutarate during the sequential addition of the Weimberg pathway enzymes (XDH, XLA, XAD, KDXD and KGSADH added, respectively, at t = 0, 90, 180, 270 and 360 min). The different intermediates, i.e., isomers and/or hydrates, determined by NMR (a), selected NMR spectra before addition of the next enzyme (*buffer signal) (b) and the metabolites followed over time with NMR and the model simulations (c) are shown. Two independent experiments were performed (for detailed NMR information, see Supplementary Note 2). A mathematical model based on equations (1) to (6) (Supplementary Note 1) was used to describe the experiment and model simulations are shown in solid lines with corresponding colours to the experimental symbols. Error bars indicate the standard error of the mean (SEM) for the two independent experiments (n = 2) and the shaded bands show the solution space for the model simulations with a 10% error margin for the parameters. For abbreviations, see Fig. 1. The source data underlying Fig. 2c are provided as a Source Data file. It can also be accessed via. 10.15490/FAIRDOMHUB.1.ASSAY.986.2 or https://jjj.bio.vu.nl/models/experiments/shen2020_fig2c/simulate.

