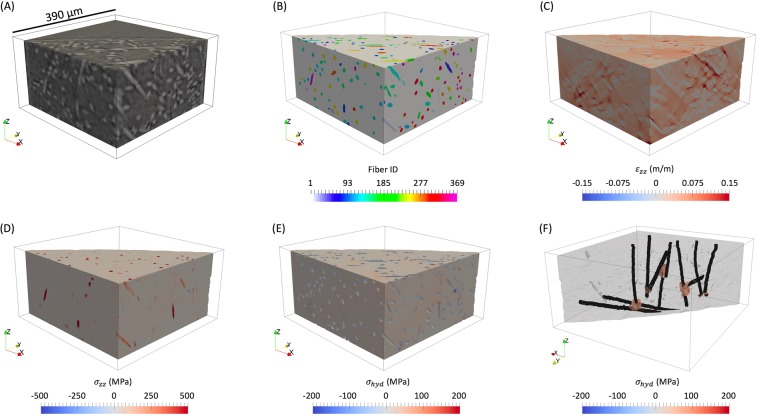
Figure 4.
An overview of the cropped simulation results (cropped to visualize away from the boundary conditions) of the specimen region shown in the tomography images of (A) which were post-processed for feature detection shown in (B). The heterogeneous strain in the loading direction () is shown in (C), the heterogeneous stress in the loading direction () is shown in (D), the heterogeneous hydrostatic stress () of the matrix is shown in (E), and the agglomerations of matrix elements in the percentile of hydrostatic stress, with the fibers they interact with, are shown in (F).

