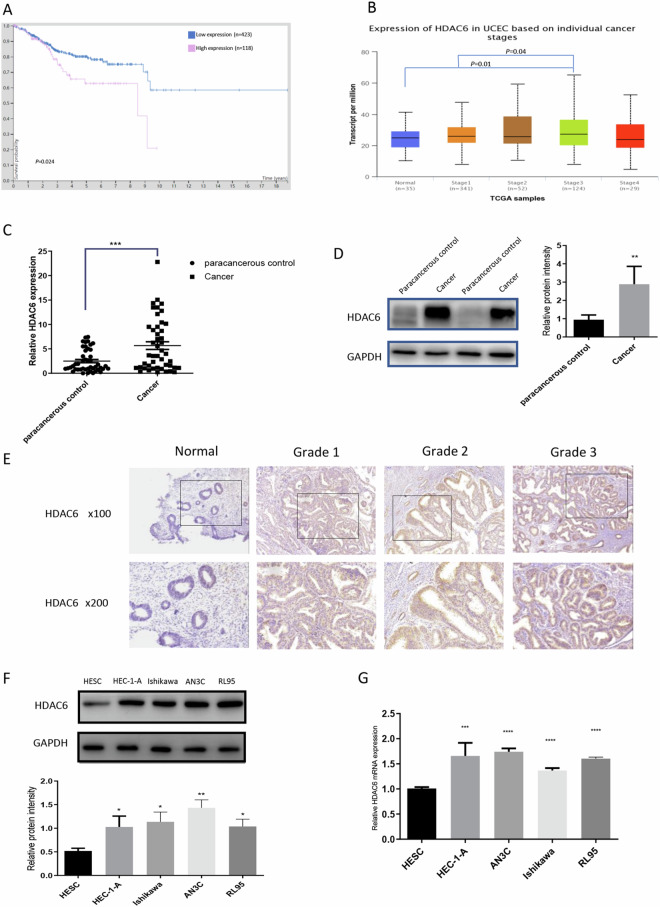
Figure 1.
HDAC6 is upregulated in EC tissues and cell lines. (A) According to the Human Protein Atlas (https://www.proteinatlas.org), Kaplan-Meier survival curves indicated that high HDAC6 expression was correlated with poorer survival probability. (B) HDAC6 expression in different EC stages according to UALCAN (http://ualcan.path.uab.edu/index.html). (C) qRT-PCR showed higher HDAC6 expression in EC tissues than in paired adjacent normal tissues (n = 46). (D) Western blot analysis showed that cancer tissues expressed more HDAC6 than paracancerous control tissues (n = 46). (E) IHC analysis showed the HDAC6 expression levels in paraffin-embedded normal endometrial and EC specimens (100×, 200×). (F) Western blot analysis showed the HDAC6 expression levels in four selected EC cell lines—HEC-1-A, Ishikawa, AN3C, and RL95—and in one immortalized endometrial fibroblast cell line. (G) qRT-PCR showed HDAC6 mRNA levels in the EC cell lines and immortalized endometrial fibroblast cell line. **P < 0.01, ***P < 0.001, ****P < 0.0001.

