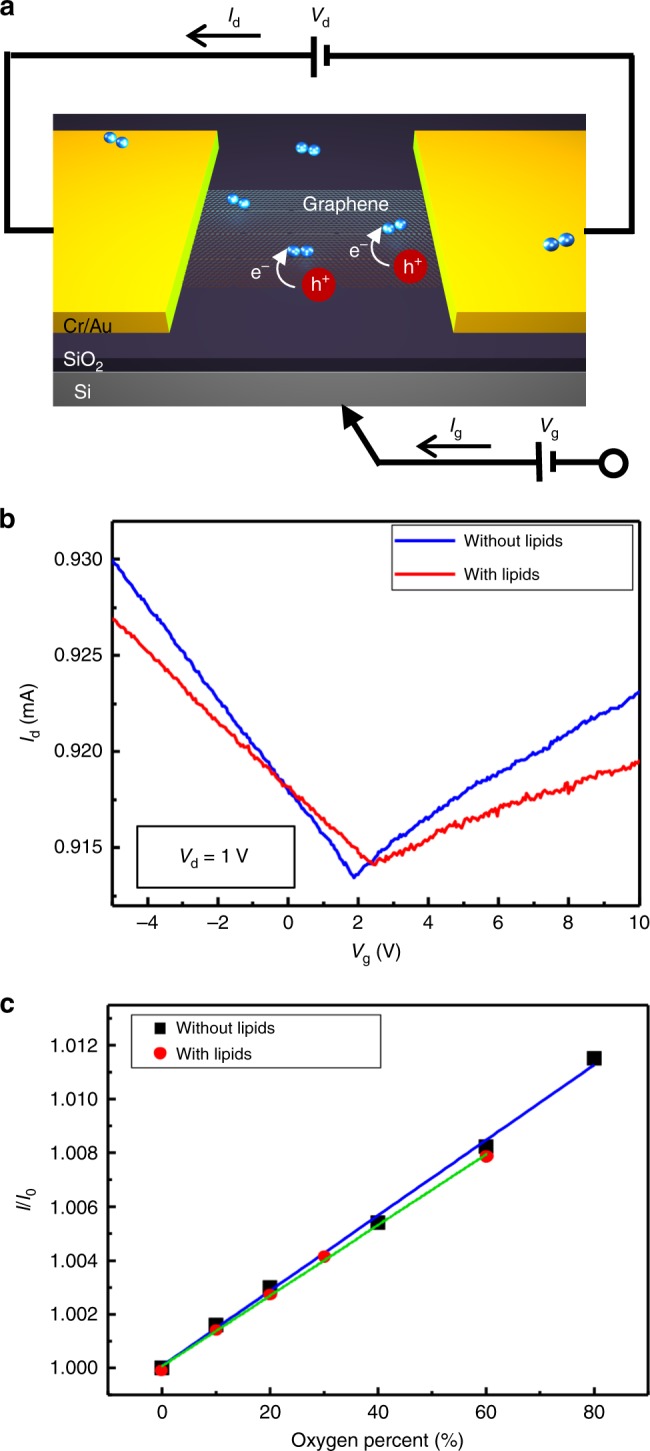
Fig. 2. Electric characteristics of graphene FET sensors.

a Schematic image describing how the FET-based sensor detects the oxygen gas using graphene. Black arrows represent the direction of drain current (). b Transfer characteristics of graphene FET. Drain voltage () is 1 V and gate voltage () is swiped from −5 to 10 V. Blue and red curve indicate Id–Vg curves of the FET sensor without and with lipid films, respectively. c Sensing response calibration graph of the oxygen gas sensor as function of oxygen percent from 0 to 80% with and without lipids. Dots represent the real response data. Blue and green lines are linear fits of with and without lipids, respectively (correlation coefficient () = 0.998).
