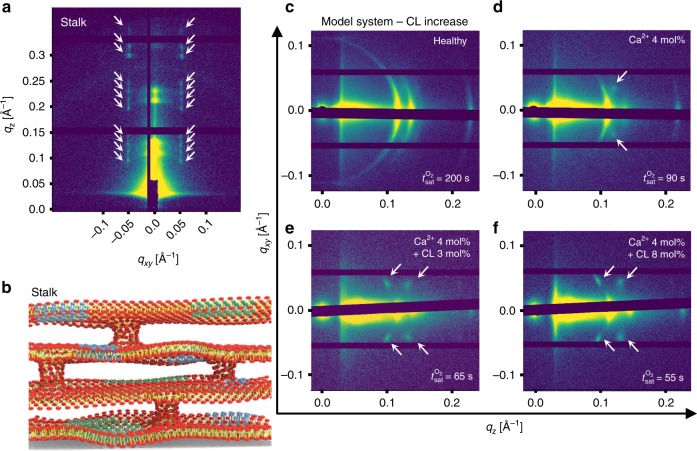
Fig. 4. GISAXS of model diseased pulmonary membranes.
a Synchrotron GISAXS of the diseased lung membrane model system. White arrows indicate stalk phase peaks which appear along the direction at 0.05 Å. b Schematic illustration of a stalk phase consisting of spatially ordered inter-bilayer contacts across a membrane with four stacked bilayers. Blue and green areas represent possible in-plane domains. c–f In-house GISAXS diffraction patterns of healthy model systems (c) and model systems with Ca 4 mol% (d), with Ca 4 mol% + cardiolipin (CL) 3 mol% (e) and with Ca 4 mol% + CL 8 mol% (f). Stalk-phase peaks are indicated by white arrows. Oxygen gas saturation times () depicted in the GISAXS images corresponds to the time that FET sensors take to get saturated with a flow of 20% oxygen gas.

