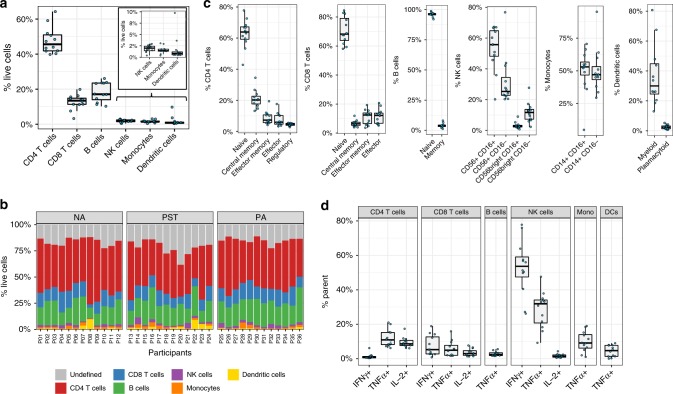
Fig. 2. Immune cell profiling of unstimulated PBMCs from 1-year-old infants by manual gating.
a The six major immune cell populations identified in unstimulated PBMC expressed as percentage of live cells in n = 12 healthy 1-year-old infants. b Stacked bar graph representing the major immune cell populations in each individual, stratified by clinical outcome for non-allergic (NA) (n = 12), peanut-sensitized tolerant (PST) (n = 12), and peanut-allergic (PA) (n = 12) infants. c Each major immune cell population was subtyped into further populations in unstimulated PBMC from n = 12 healthy infants. d Percentage of CD4 T cells, CD8 T cells, B cells, NK cells, monocytes, and dendritic cells (DCs) producing IFNγ, TNFα, or IL-2 following 24 h stimulation of PBMC with PMA/ionomycin in n = 12 healthy infants. In the boxplots, the medians are shown. The “hinges” represent the first and third quartile. The whiskers are the smallest and largest values after exclusion of outliers (greater than the 75th percentile plus 1.5 times the IQR or less than 25th percentile minus 1.5 times the IQR). Source data are provided as a Source Data file.

