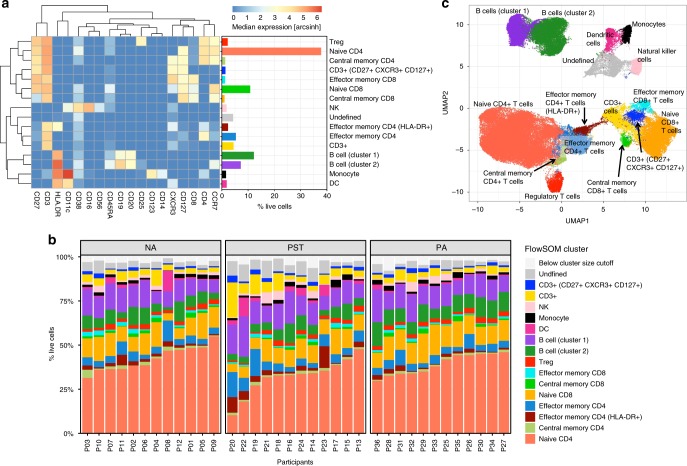
Fig. 3. Unsupervised analysis using FlowSOM reveals distinct immune cell clusters in PBMC from 1-year-old infants.
a Clustering analysis with FlowSOM revealed 16 cell clusters, shown here as a heatmap of the median expression of 18 lineage markers along with a bar graph representing each cluster as percentage of live cells and the cell phenotype that each cluster was assigned based on lineage marker expression pattern. b Stacked bar graph representing all clusters identified in each individual, stratified by clinical outcome for non-allergic (NA) (n = 12), peanut-sensitized tolerant (PST) (n = 12), and peanut-allergic (PA) (n = 12) infants. Clusters with <1% of the analyzed cells were excluded from all other analyses and are represented here as “below cluster size cutoff”. c Uniform Manifold Approximation and Projection (UMAP) representation of 100,008 randomly selected cells (2778 per file) with clusters from the FlowSOM analysis overlaid. The same color is used for each cluster/cell type across all plots. Source data are provided as a Source Data file.

