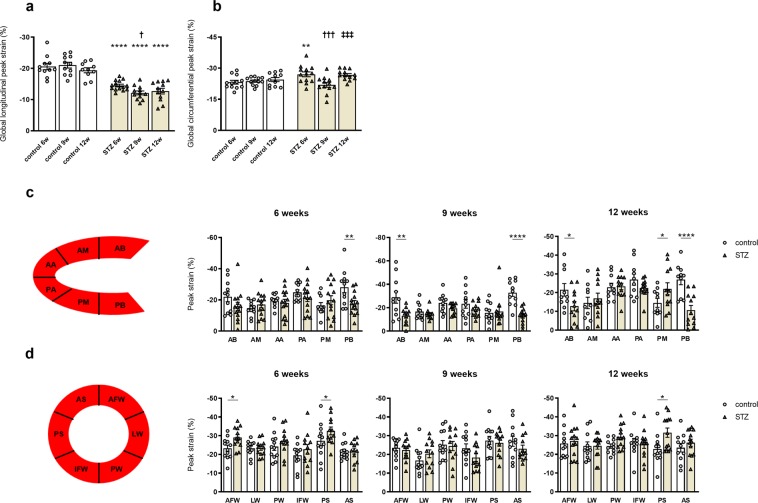
Figure 3.
STZ-induced type 1 diabetes mellitus reduces global peak strain. Two-dimensional STE was used to further determine GLS (a) and GCS (b). Quantitative segmental analysis in long axis (c) and short axis view (d) confirmed time-dependent changes in myocardial deformation behaviour. AA Anterior Apex; AB Anterior Base; AFW Anterior Free Wall; AM Anterior Mid; AS Anterior Septum; IFW Inferior Free Wall; LW Lateral Wall; PA Posterior Apex; PB Posterior Base; PM Posterior Mid; PS Posterior Septal Wall; PW Posterior Wall. Bar graphs represent the mean ± SEM. Data were analysed with One-way ANOVA or Kruskal-Wallis test (*p < 0.05; **p < 0.01, ***p < 0.001, ***p < 0.0001 versus corresponding control; †p < 0.05, ††p < 0.01, †††p < 0.001, ††††p < 0.0001 versus the 6w STZ; ‡p < 0.05, ‡‡p < 0.01, ‡‡‡p < 0.001, ‡‡‡‡p < 0.0001 versus the 9w STZ; n = 12/controls and n = 14/STZ).

