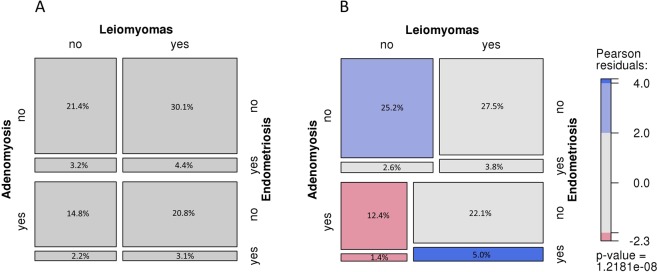
Figure 1.
Mosaic plot of co-occurrences of leiomyomas, adenomyosis and endometriosis. Mosaic plot of expected (A) and observed (B) frequencies of comorbidities of leiomyomas, adenomyosis and endometriosis in EC patients (n = 1399). Tiles sizes are proportional to the (A) expected and (B) observed frequencies of 3-way subsets of conditions among all EC patients (n = 1399). In panel B, shading indicates Pearson residuals from chi-square test for independence of gynecological conditions; blue indicates positive residuals and pink indicates negative residuals; colour intensity correlates with the size of the residuals; overall p-value suggests strong evidence for departure from the null.

