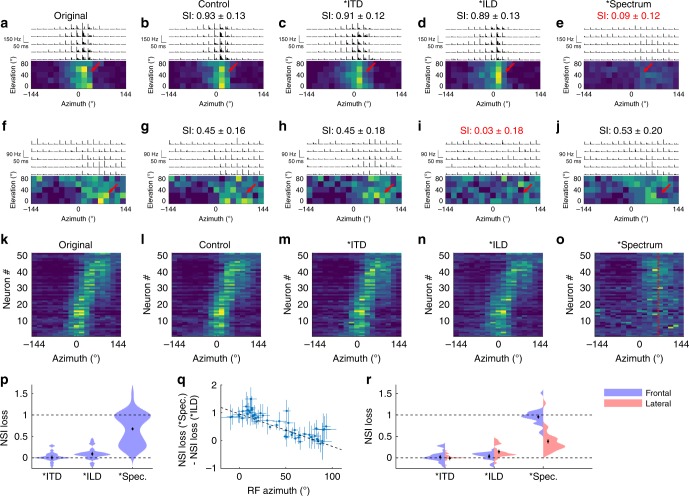
Fig. 3. Structural changes of auditory RFs due to interaural timing difference (ITD), interaural level difference (ILD), and spectral-cue freezing.
a–e RFs of a single neuron in response to the a original, b control, c frozen ITD, d frozen average ILD, and e frozen spectrum stimuli. An asterisk (*) indicates that the corresponding cue is frozen. b–e indicate the similarity index (SI; see text). This neuron’s RF structure did not change during ITD and ILD freezing, but it disappears with spectrum freezing (red arrow). f–j Example responses from another neuron whose RF disappears with ILD freezing (red arrow). k–o Summary of the horizontal RFs of all 51 neurons that had a reproducible RF. For each neuron, the scale of the responses is normalized by dividing by the sum of responses across all directions. The range of the color scale is from 0 to 0.3. The neurons are sorted by their tuned azimuth. Little changes in the RFs are observed with ITD and ILD freezing (m, n), but a dramatic change of the RF structure was observed with spectrum freezing (o). With spectrum freezing, all the RF centers become close to 65° azimuth where the ILD is maximized (red dotted line). p Summary of normalized similarity index (NSI) losses in the cue freezing experiments. A large NSI loss is observed with spectrum freezing, consistent with m–o. Source data are provided as a Source Data file. q A scatter plot of the RF azimuths and the differences between spectral-cue and ILD NSI losses. As the RF azimuth increases, neurons depend less on spectral cues and more on ILDs (r = −0.83). The errors in X-axis are derived from the Kent distribution fits; the errors in Y-axis are based on the Poisson statistics and arithmetic propagation (see Methods). r Comparison of the average NSI loss for frontal and lateral RFs. Neurons with frontal rather than lateral RFs depend almost entirely on spectral cues. Source data are provided as a Source Data file.

