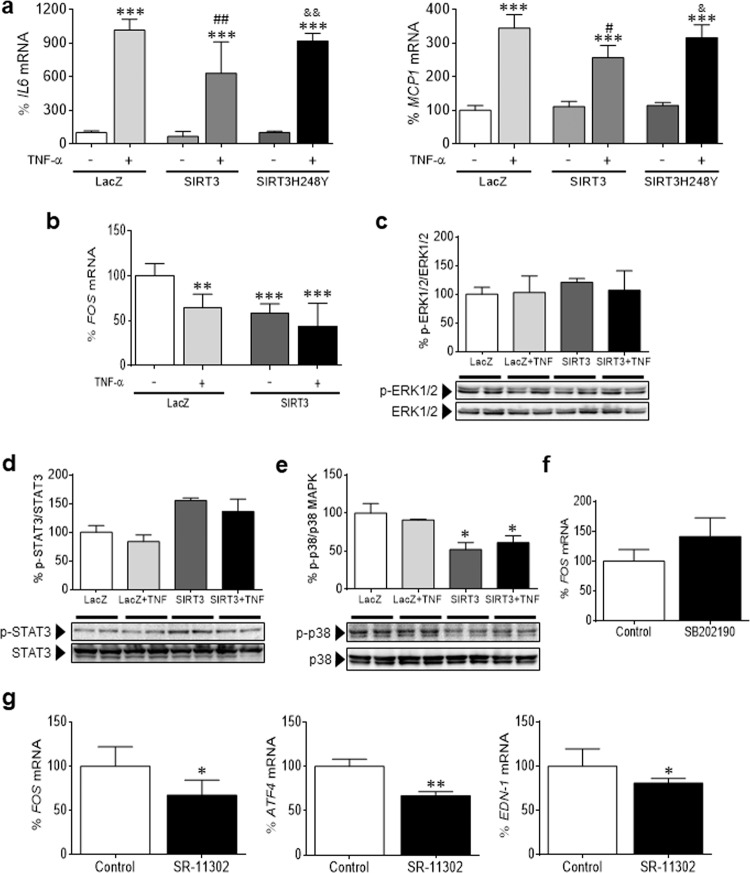
Fig. 5.
FOS is not transcriptionally regulated by STAT3 or MAPK. a Relative quantification of IL6 and MCP1 mRNA expression in human AC16 cardiac cells transfected with LacZ-carrying, SIRT3-carrying, or SIRT3H248Y-carrying plasmids in the presence or absence of TNF-α. b Relative quantification of FOS mRNA expression in human AC16 cardiac cells transfected with LacZ-carrying or SIRT3-carrying plasmids in the presence or absence of TNF-α. Western blot analysis showing the protein levels of phosphorylated ERK1/2Thr202/Tyr204/ERK1/2 c, phosphorylated STAT3Ser727/STAT3 d, and phosphorylated p38Thr180/Tyr182/p38 MAPK e in total protein extracts obtained from human AC16 cardiac cells transfected with LacZ-carrying or SIRT3-carrying plasmids in the presence or absence of TNF-α (TNF, 10 ng/mL, 24 h). f Relative quantification of FOS mRNA levels in human AC16 cardiac cells incubated in the presence or absence of the p38 MAPK inhibitor SB202190 (10 μmol/mL, 24 h). The graphs represent the quantification of protein levels normalized to actin and are expressed as a percentage of the control samples ± SD. g Relative quantification of FOS, ATF4, and EDN-1 mRNA levels in human AC16 cardiac cells incubated in the presence or absence of the AP-1 inhibitor SR-11302 (10 μmol/L, 24 h). The graphs represent the quantification of the GAPDH-normalized mRNA levels a, b, f, and g or the quantification of protein levels normalized to GAPDH c–e, expressed as a percentage of the control samples ± SD. Comparisons were performed by ANOVA followed by Tukey’s posttest (panels a–e) or unpaired two-tailed Student’s t-test (panels f and g). a–e *P < 0.05, **P < 0.01, and ***P < 0.001 vs. LacZ; #P < 0.05, ##P < 0.01, and ###P < 0.001 vs. LacZ + TNF-α; ┼P < 0.05, ┼┼P < 0.01, and ┼┼┼P < 0.001 vs. SIRT3; &P < 0.05, &&P < 0.01, and &&&P < 0.001 vs. SIRT3 + TNF-α. f and g *P < 0.05, **P < 0.01, and ***P < 0.001 vs. Control

