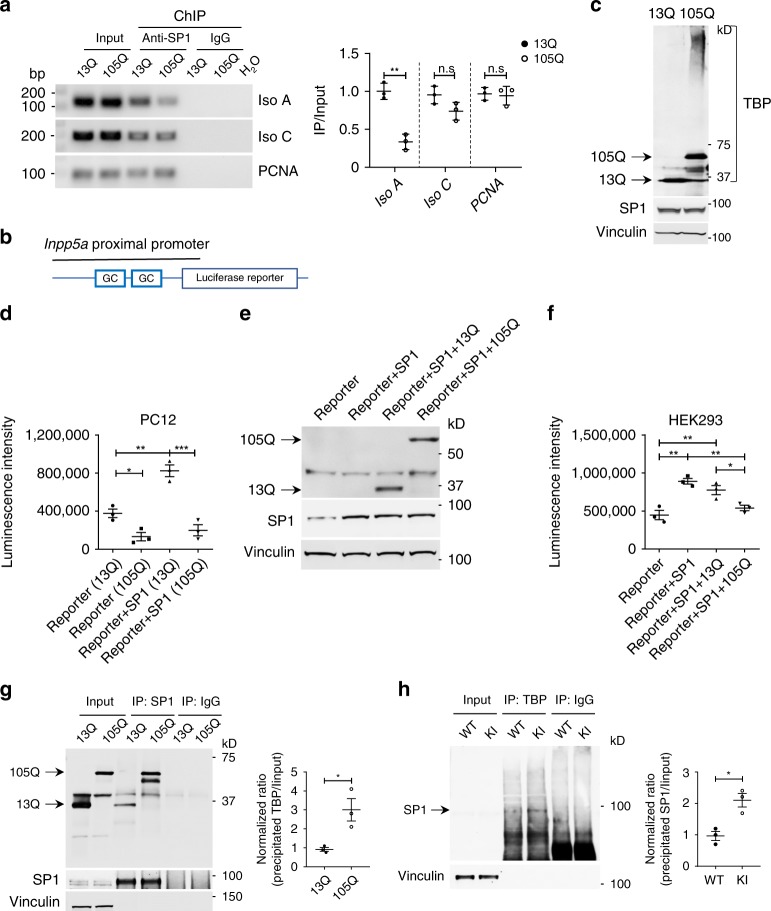
Fig. 5. Expanded polyQ affects the interaction between TBP and SP1 and impairs the transcription of Inpp5a.
a Chromatin immunoprecipitation (ChIP) assay of SP1 association with the Inpp5a promoter in HEK293 cells transfected with TBP-13Q or TBP-105Q. Cross-linked chromatin materials were immunoprecipitated (IP) by anti-SP1 and were subjected to polymerase chain reaction (PCR) with primers specific for the promoter region of Inpp5a and PCNA (proliferating cell nuclear antigen), which served as a control. Representative agarose gel electrophoresis images of PCR products (left). Quantification of the ratios of immunoprecipitated products to input is presented (right). T = 7.757, **P = 0.0015 (unpaired t test). b Schematic map of a luciferase construct for reporter assay. c Western blotting showing the expression of SP1 and TBP in transfected PC12 cells. d Luciferase activity analysis of stable PC12 cell lines expressing TBP-13Q or TBP-105Q with or without transfected SP1. Luminescence intensity was analyzed with one-way ANOVA followed with Tukey’s multiple comparisons test. F = 35.19, *P < 0.05, **P < 0.005, ***P < 0.0005. e Western blot analysis of HEK293 cells transfected with SP1 and TBP-13Q or 105Q. f Luciferase activity analysis of transfected HEK293 cells. Cells transfected only with Inpp5a promoter reporter were used as control. Luminescence intensity was analyzed with one-way ANOVA followed with Tukey’s multiple comparisons test. F = 16.39, *P < 0.05, **P < 0.005. g Co-immunoprecipitation of transfected SP1 with TBP-13Q or TBP-105Q in HEK293 cells showing an increased interaction of SP1 with soluble TBP-105Q compared to TBP-13Q. Right panel showing the ratio of precipitated TBP to input. T = 3.518, *P = 0.0245 (Student’s t test). h TBP antibody immunoprecipitation of mouse cerebellar lysates also showed that more SP1 was coprecipitated in KI mice than in WT mice. One-month-old mice were used. Right panel showing the ratio of precipitated SP1 to input. T = 4.389, *P = 0.0118 (Student’s t test). Data are represented as mean ± SEM. Source data and full blots are provided as a Source Data file.

