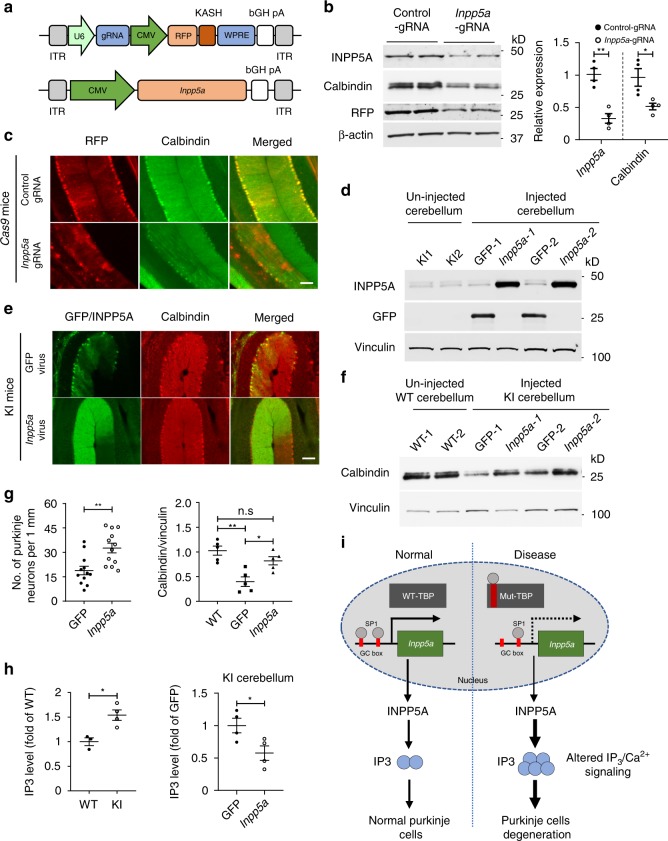
Fig. 6. Inpp5a Knockdown leads to Purkinje cell degeneration, whereas Inpp5a overexpression reduces Purkinje cell degeneration.
a Schematic diagram of AAV-Inpp5a gRNA and AAV-Inpp5a vectors. b Western blotting analysis of INPP5A and calbindin in AAV-control gRNA or AAV-Inpp5a gRNA-injected 3-month-old EIIa-Cas9 transgenic mice cerebellum (left panel). The densitometric ratios of INPP5A to β-actin and calbindin to β-actin were normalized to control and analyzed with Student’s t test (right panel). Calbindin, t = 3.095, *P = 0.0213; Inpp5a, t = 5.79, **P = 0.0012, n = 4 mice per group. c Representative immunofluorescence images of AAV-gRNA-injected Cas9 mouse cerebellum without mutant TBP. d Western blotting showing the expression of AAV-Inpp5a or AAV-GFP in the injected KI mouse cerebellum. e Representative immunofluorescence images of AAV-Inpp5a or AAV-GFP-injected 5-month-old KI mouse cerebellum. f Western blotting showing increased calbindin in the cerebellum of SCA17 mice after injection of AAV-Inpp5a. AAV-GFP injection served as control. g Quantification of Purkinje cells (left panel) in e was analyzed with Student’s t test, t = 3.483, *P = 0.0011, n = 4 mice per group, three images were used to count from each mouse. The densitometric ratios of calbindin to vinculin in f were normalized to WT and analyzed with one-way ANOVA followed with Tukey’s multiple comparisons test. F = 12.32, *P < 0.05, **P < 0.005. n = 5 mice per group. h IP3 ELISA assay of cerebellar lysates from 2-month-old KI mice and age-matched WT mice (left) and from AAV-Inpp5a or AAV-GFP-injected 3-month-old KI mice (right). IP3 levels (fold of WT or fold of GFP) were analyzed with Student’s t test, t = 3.77, *P = 0.013 (left); t = 2.681, *P = 0.0365 (right), n = 3–4 mice per group. i A proposed model for selective neurodegeneration in SCA17. Mutant TBP downregulates INPP5A by inhibiting SP1 from activating Inpp5a transcription. The reduction of INPP5A dysregulates the IP3/Ca2+ pathway, leading to Purkinje cell degeneration. Scale bar = 100 μm. Data are represented as mean ± SEM. Source data and full blots are provided as a Source Data file.

