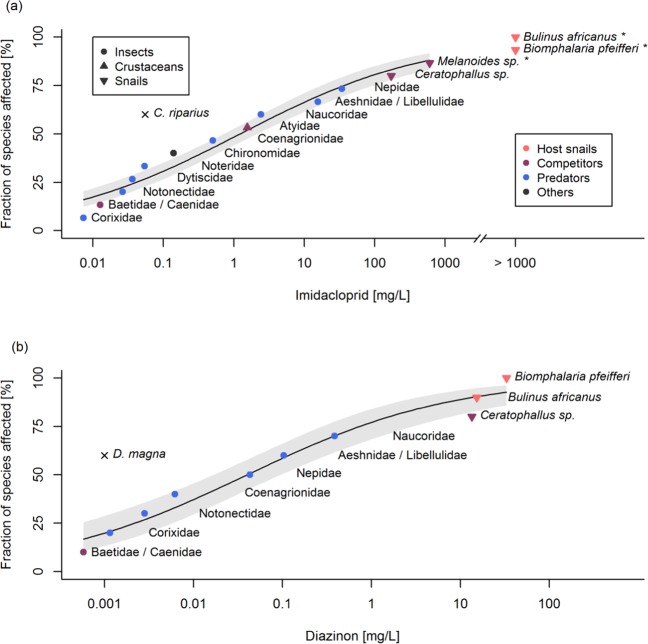
Figure 2.
Species sensitivity distribution (SSD) of freshwater macroinvertebrates from the study region to common agricultural insecticides. Data points show the acute LC5024h for various species. The SSD curves were fitted using a quasibinomial GLM with logit-link; means ± 95% confidence intervals are shown. (a) Sensitivity distribution to the neonicotinoid insecticide imidacloprid. χ² = 230.69, res. df = 11, p < 0.001, McKelvey-Zavoina’s pseudo-R² = 0.29. For Melanoides sp., Bulinus africanus and Biomphalaria pfeifferi the LC50 exceeded the highest test concentration and was extrapolated from non-linear regression (Melanoides sp.) or estimated. (b) Sensitivity distribution to the organophosphorus insecticide Diazinon. χ² = 115.89, res. df = 8, p < 0.001, McKelvey-Zavoina’s pseudo-R² = 0.40. (a,b) The acute LC5048h of the most sensitive standard reference taxa (Chironomus riparius and Daphnia magna) was added for comparison32,78 and used for the calculation of toxic units (see text).

