
Fig. 7. Introduction threshold comparison.
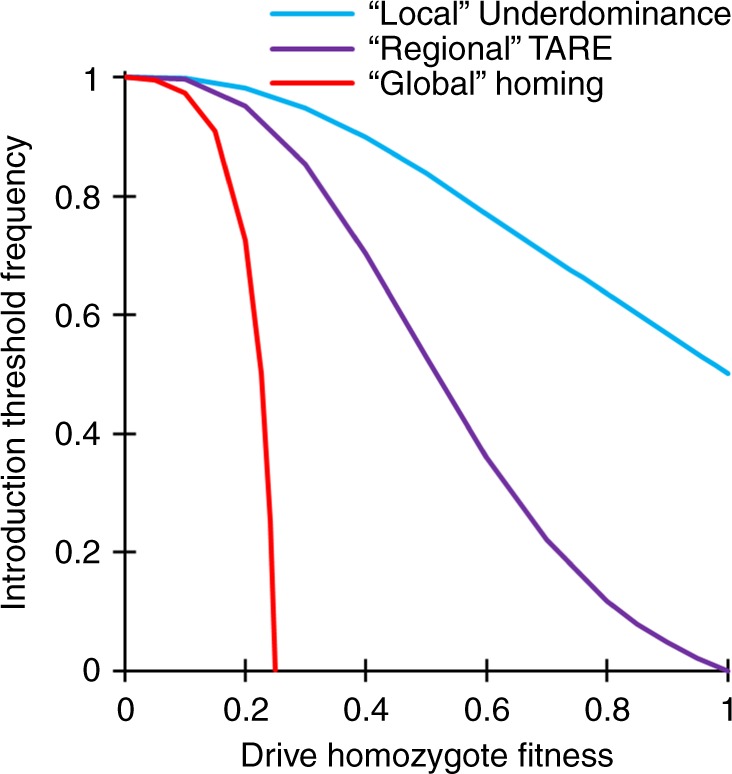
The chart shows the introduction threshold frequencies for drive homozygotes as a function of the drive fitness cost in homozygotes using a deterministic model of a single panmictic population. These thresholds represent unstable equilibria above which the drive increases in frequency and below which the drive is removed. All drives are idealized, and the underdominance system uses a single locus with heterozygote disadvantage44,51.