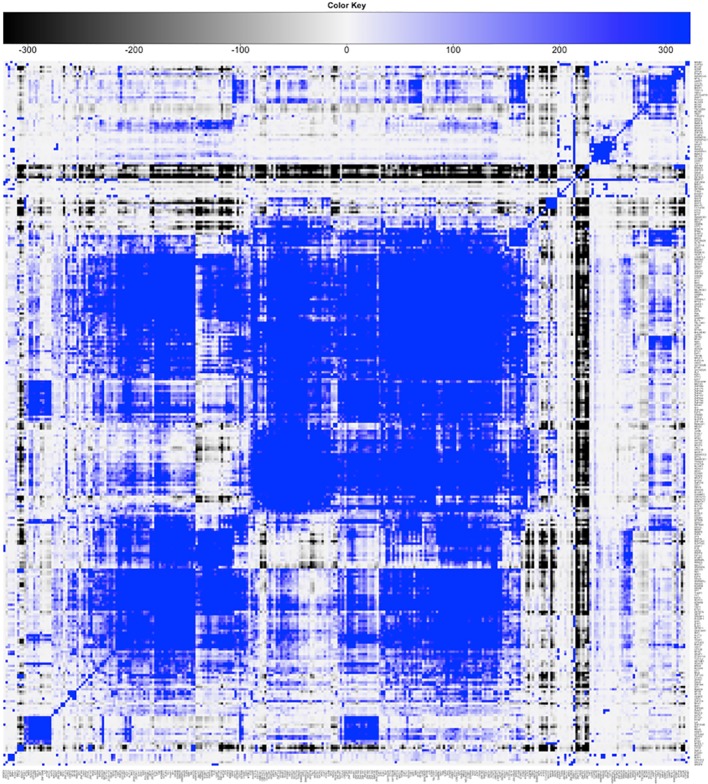
Figure 3.
Result of step 1 of the pipeline. Clustered heatmap of pairwise coassociation scores among 329 ENCODE ChIP-Seq experiments in the K562 cell line. Coassociation scores are defined as −log10 of the p-value if the overlap is higher than expected, log10 of the p-value otherwise. Pearson correlation was employed as distance for clustering.

