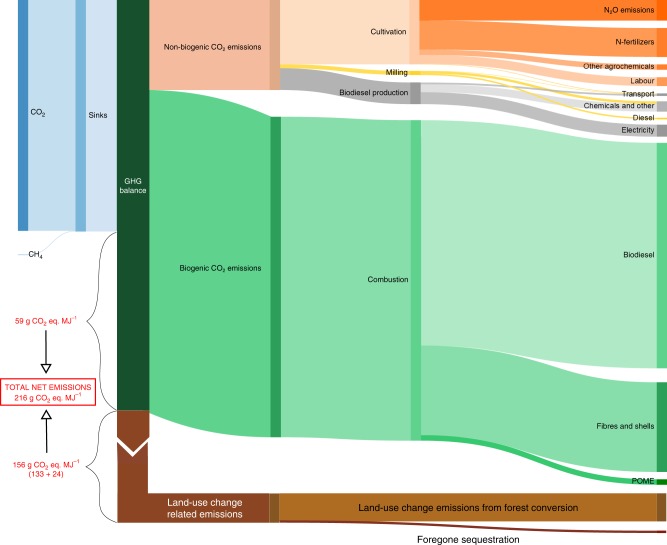
Fig. 3. Detailed life cycle analysis for business-as-usual scenario.
Detailed life cycle analysis of palm-oil biodiesel for the business-as-usual scenario in the first-rotation cycle. Greenhouse gas (GHG) budget over the entire plantation life cycle of 25 years. Each box represents a GHG flux and box sizes are proportional to flux magnitude. The GHG balance box (dark green) comprises the GHG sinks to its left and the emissions to its right. The difference between sinks and emissions, i.e., the net GHG emissions, are indicated by brackets. Sinks (left side, blue) by the ecosystem include carbon dioxide (CO2) and methane (CH4) fluxes. Emissions (right side) are separated into the phase along the cycle, in which they occur, i.e., palm oil cultivation (orange), milling (yellow), biodiesel production (grey), biogenic emissions occurring during the use of the different products obtained along the system (green), land-use change emissions from forest conversion (light brown) and foregone sequestration (dark brown). All fluxes are expressed in gCO2-eq. MJ−1. Due to their large magnitude, box sizes for land-use change-related emissions are not proportional to the magnitude of the fluxes. See Supplementary Table 3 for further details on the business-as-usual scenario.

