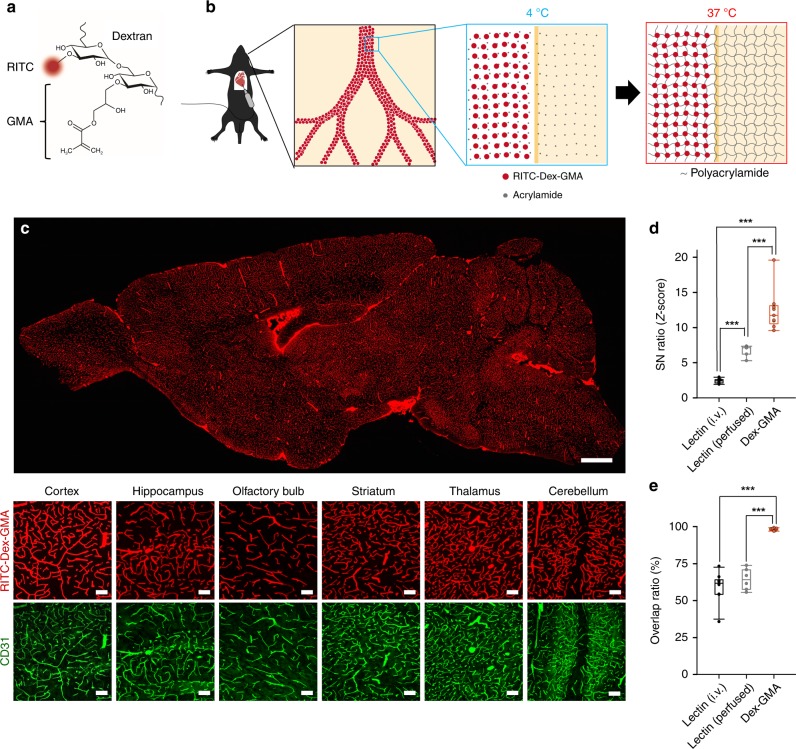
Fig. 1. Near-complete visualization of cerebral vasculature using thermally controlled polymerization of a BBB-impermeable fluorescent crosslinker.
a Design of the BBB impermeable fluorescent crosslinker RITC–Dex–GMA. The fluorophore RITC and the crosslinkable group GMA are chemically linked through dextran, a BBB-impermeable molecule. b Strategic concept of vascular casting using a hybrid hydrogel. Red circles and gray dots indicate RITC–Dex–GMA and acrylamide, respectively. c Top: A confocal image of a sagittal section of an adult mouse brain treated with vascular casting using RITC–Dex–GMA, acrylamide, and VA-044. Scale bar = 1 mm. Bottom: Magnified images of RITC–Dex–GMA-casted vasculature of different brain regions (red) and endothelial cells counterstained using anti-CD31 in the same fields (green). Scale bar = 100 μm. d SN ratios of the fluorescence intensities in lectin-based and Dex–GMA-based visualization (n = 10, 6, and 9 slices from 10, 6, and 9 mice, respectively; box plots indicate median and 25–75% interquartile ranges; whiskers cover 10−90% quantiles. P = 2.94 × 10⁻¹⁰, F2,22 = 69.9, one-way ANOVA; Dex-GMA versus lectin (i.v.); ***P = 1.59 × 10⁻¹⁰, Q2,22 = 16.7; Dex–GMA versus lectin (perfused); ***P = 2.01 × 10⁻⁵, Q2,22 = 8.27; lectin (i.v.) versus lectin (perfused): ***P = 4.53 × 10⁻⁴, Q2,22 = 6.42, Tukey’s test). e Overlap ratios between anti-CD31 immunoreactivity and Texas Red/RITC fluorescence in lectin-based and Dex–GMA-based visualization (59.4 ± 9.45%, 64.4 ± 7.32%, and 98.2 ± 0.8%, mean ± SD of 10, 6, and 9 slices from 10, 6, and 9 mice, respectively; box plots indicate median and 25−75% interquartile ranges; whiskers cover 10−90% quantiles. P = 1.59 × 10⁻¹⁰, F2,22 = 74.5, one-way ANOVA; Dex–GMA versus lectin (i.v.); ***P = 2.39 × 10⁻¹⁰, Q2,22 = 16.4; Dex–GMA versus lectin (perfused); ***P = 3.51 × 10⁻⁸, Q2,22 = 12.4; lectin (i.v.) versus lectin (perfused): P = 0.401, Q2,22 = 1.86, Tukey’s test). Source data are provided as a Source Data file.

