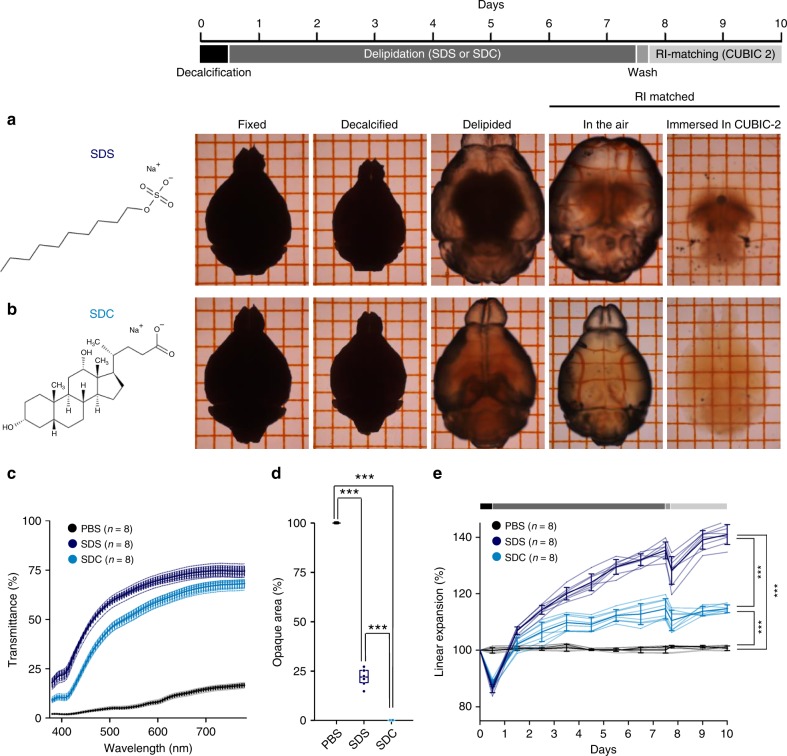
Fig. 2. Rapid tissue clearing with sodium deoxycholate.
a, b Time-series of photographs of a brain taken at each step of tissue clearing. The fixed brain was treated with EDTA for 12 h followed by SDS a or SDC b for 7 d (daily refreshed), washed with PBS and refractive index (RI)-matched in ScaleCUBIC-2 for 2 d. In the SDS-treated group, the white matter remained opaque, and the sample swelled. In the SDC-treated group, the cleared brain was still pale yellow, but the white matter was transparent. The sample swelled to a lesser extent. The grid interval is 2 mm. c The light transmittance (380–780 nm) of fixed whole brains treated with SDS and ScaleCUBIC-2 (dark blue), with SDC and ScaleCUBIC-2 (light blue) or with PBS (black) (n = 8 brains each, P = 2.22 × 10⁻¹⁶, F2,889 = 4.56 × 10⁴, two-way ANOVA (between groups)). d Percentages of opaque area in the whole brains treated with SDS and ScaleCUBIC-2, with SDC and ScaleCUBIC-2, or with PBS (n = 8 brains each; box plots indicate median and 25−75% interquartile ranges, P = 2.22 × 10⁻¹⁶, F2,21 = 4.08 × 10³, one-way ANOVA; SDC versus SDS: ***P = 7.47 × 10⁻¹⁴, Q2,21 = 26.73; SDS versus PBS: ***P = 4.36 × 10⁻¹⁴, Q2,21 = 94.78; SDC versus PBS: ***P = 4.36 × 10⁻¹⁴, Q2,21 = 121.5, Tukey’s test). e Time course of tissue expansion during clearing (n = 8 brains each, P = 2.22 × 10⁻¹⁶, F2,21 = 6.66 × 10², one-way ANOVA; SDC versus SDS: ***P = 4.41 × 10⁻¹⁴, Q2,21 = 33.15; SDC versus PBS: ***P = 9.92 × 10⁻¹¹, Q2,21 = 17.69; SDS versus PBS: ***P = 4.36 × 10⁻¹⁴, Q2,21 = 50.84, Tukey’s test). Error bars represent standard deviations. Source data are provided as a Source Data file.

