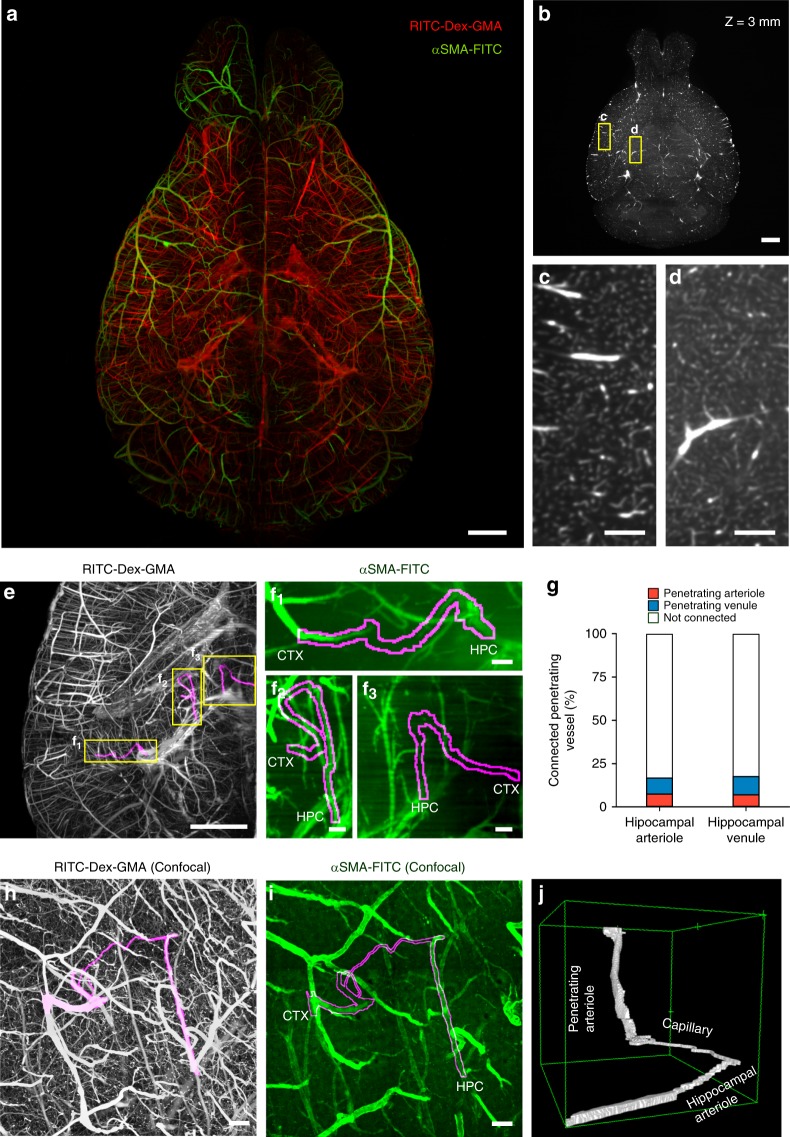
Fig. 5. Large-scale molecular phenotyping-compatible 3D imaging of cerebral vasculature.
a Maximum projection of light-sheet fluorescence microscopic images of the entire vasculature in a SeeNet-treated brain (1.6× zoom, ×0.63 objective lens, numerical aperture: 0.15, working distance: 87 mm) into a single stacked photo. Casted vessels are shown in red. Arterioles immunolabeled with anti-αSMA are shown in green. Scale bar = 1 mm. b The RITC–Dex–GMA signal in a, shown on a grayscale, was optically sectioned at Z = 3 mm. Scale bar = 1 mm. c, d Magnified images of the boxed region of b. Vasculature in the gray matter c and white matter d was visualized with capillary resolution. Scale bar = 200 μm. e The RITC–Dex–GMA signal in a posterior part of the left hemisphere in a is shown on a grayscale. Magenta indicates cortico-hippocampal vascular paths observed in this area. Scale bar = 1 mm. See also Supplementary Movie 3. f The anti-αSMA immunosignal of the boxed regions in e is shown on a green scale. Magenta contours indicate cortico-hippocampal vascular paths. Each end of the vascular path is denoted by CTX (cortical side) or HPC (hippocampal side). Arteriole–arteriole (f1), venule–arteriole (f2), and venule–venule (f3) connections were observed. Scale bar = 100 μm. See also Supplementary Movie 4. g The percentage of the connected pairs of dorsal hippocampal transverse arterioles (red) and venules (blue) to the total number of vessels observed. h Maximum projection of confocal images of casted vasculatures from the pia to the hippocampus. A cortico-hippocampal vascular path is shown in magenta. Scale bar = 100 μm. See also Supplementary Movie 5. i The anti-αSMA immunosignal in the same field is shown on a green scale. Scale bar = 100 μm. See also Supplementary Movie 6. j A 3D-rendered view of the cortico-hippocampal vascular path. Source data are provided as a Source Data file.

