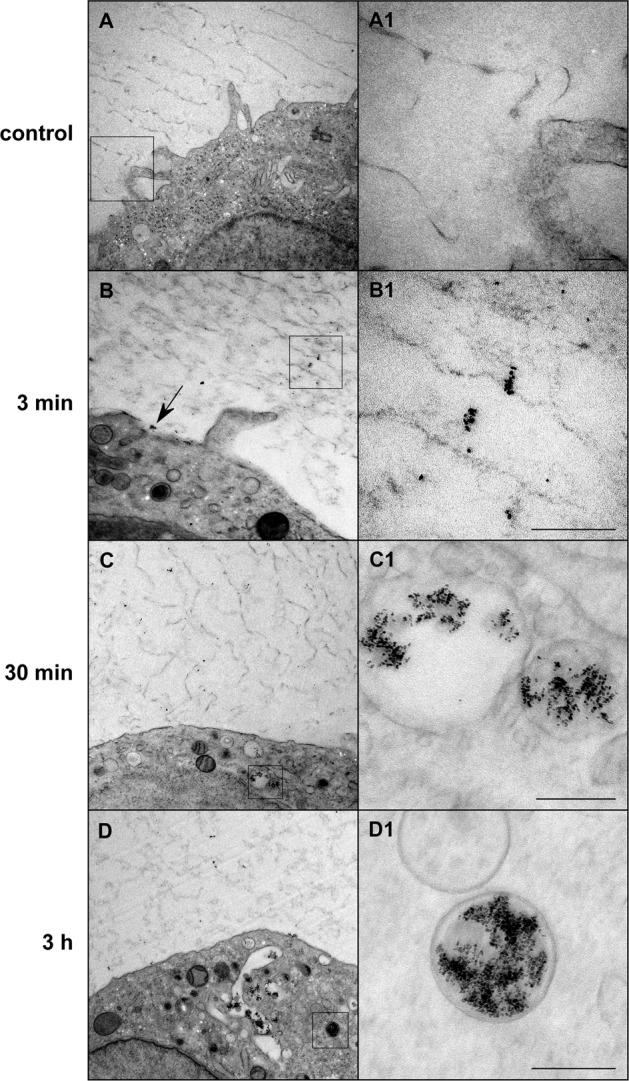
Figure 4.

HPF/FS-TEM images showing the binding and uptake process of VSOP into THP-1 monocytes at the indicated incubation times. The control images A and A1 show a monocyte that was not incubated with VSOP. A1–D1 represent high-magnification images of the delineated area in A–D. VSOP are visible as black round structures with an individual nanoparticle diameter of 4–8 nm. The black arrow in B points to a small VSOP aggregate bound to the cell surface membrane. Scale bars depict 200 nm.
