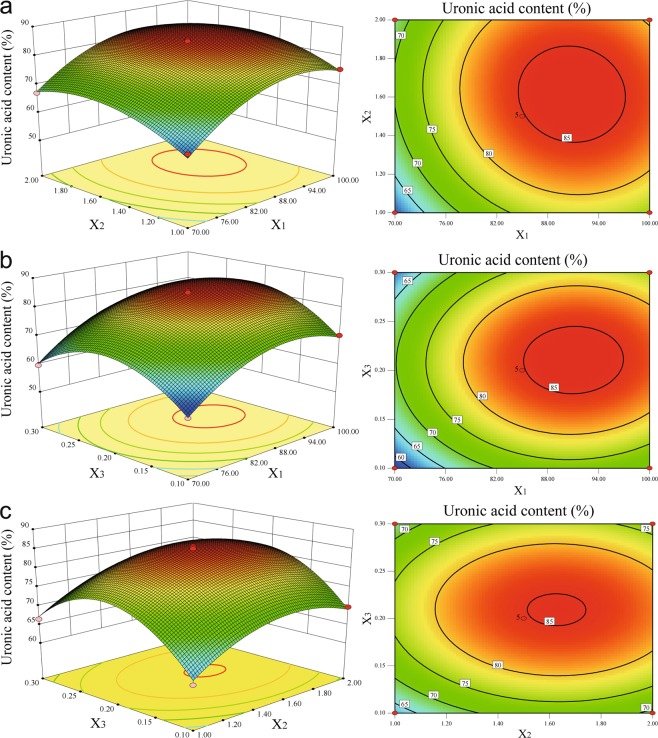
Figure 3.
Response surface plots and contour plots showing the effect of the extraction temperature (X1), extraction time (X2) and oxalic acid concentration (X3) on the uronic acid content of LAHP. (a) Response surface and contour plots of the uronic acid content as a function of X1 and X2. (b) Response surface and contour plots of the uronic acid content as a function of X1 and X3. (c) Response surface and contour plots of the uronic acid content as a function of X2 and X3.

