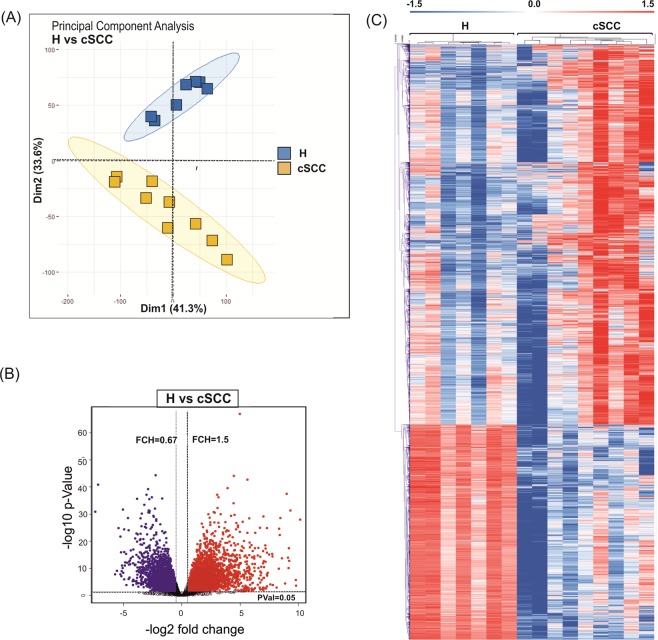
Figure 1.
Analysis of the protein-coding transcriptome in cSCC. (A) Principal component analysis of samples obtained frmo healthy skin samples (H; blue) and cSCC (cSCC; yellow) based on RNA-seq data. (B) Volcano plot shows the result of EdgeR-analysis of all detected mRNAs (log2 fold change versus log10 nominal P-value for all detected genes). Vertical lines denote the fold change cutoff, while the horizontal line denotes the P-value cutoff. Red color represents upregulated and blue color represents downregulated coding transcripts. (C) Heatmap and hierarchical clustering of all differentially expressed protein-coding genes in cSCC (FDR < 0.05 and FCH > 1.5).

