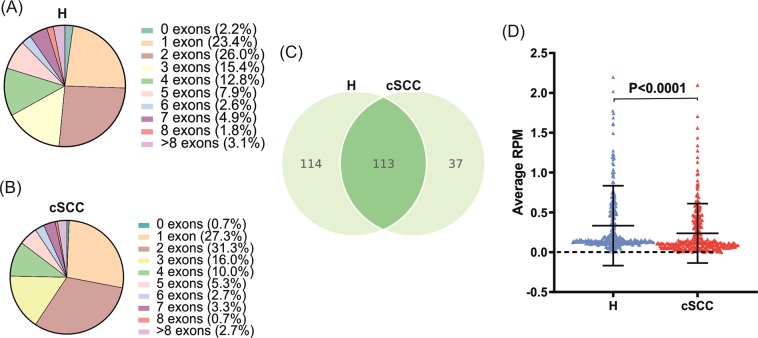
Figure 5.
Detection of abundant circRNAs in healthy skin and cSCC. Pie charts showing the distribution of the numbers of exons annotated within the back-splicing junction of the high abundance circRNAs in healthy skin (A) and in cSCC (B). (C) Venn-diagram showing the overlap between the high abundance circRNAs detected in the normal skin biopsies (left) and the cSCC biopsies (right). (D) Column scatter plot showing the average RPM for the 264 unique high abundance circRNAs detected in the normal skin- and cSCC biopsies combined. Mann-Whitney U test.

