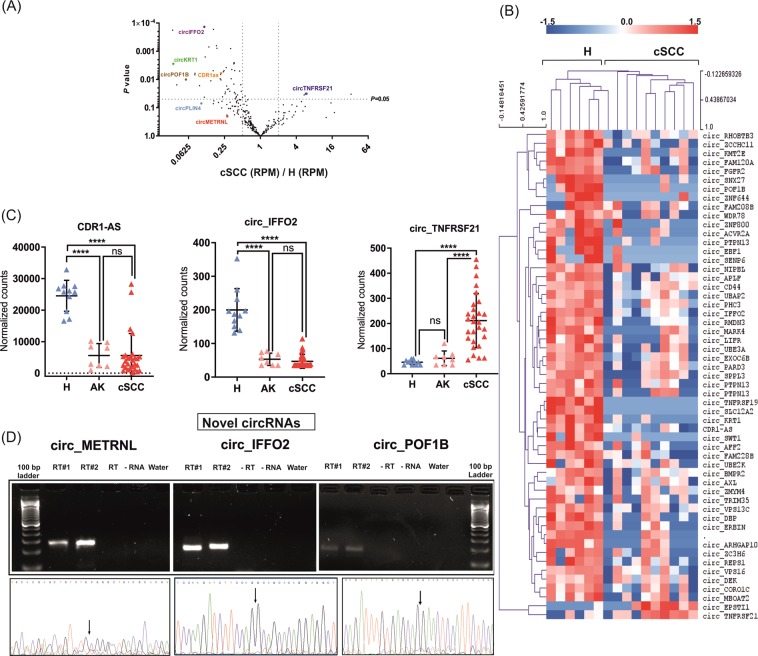
Figure 6.
Analysis of differentially expressed circRNAs in cSCC. (A) Volcano plot showing the fold changes in RPM vs P-values for the 264 unique high abundance circRNAs with the exception of circRNAs that were not expressed in either of the sample groups. (B) Heatmap and hierarchical clustering of all 55 differentially expressed circRNAs in cSCC. Red color represents upregulated and blue color represents downregulated circRNAs. (C) Validation of selected differentially expressed circRNAs (CDR-AS1, circ_IFFO2 and circ_TNFRSF21) by NanoString nCounter assay in healthy skin (H, n = 11), AK (n = 8) and cSCC (n = 28). Target gene expression is presented as background-corrected and normalized counts (threshold count of 35). ****P < 0.0001, Mann-Whitney U test. (D) Validation of the novel circRNAs (circ_METRNL, circ_IFFO2 and circ_POF1B) detected in our analysis by PCR using divergent primers and Sanger sequencing. The agarose gel image showed the expected size of PCR product present only in the reverse-transcribed samples. Below the agarose gel images, corresponding Sanger sequencing chromatograms across the backsplicing junction are shown. Arrows indicate the back-splicing junctions. Gel images for respective circRNA transcripts were cropped from the different parts of a single gel.

