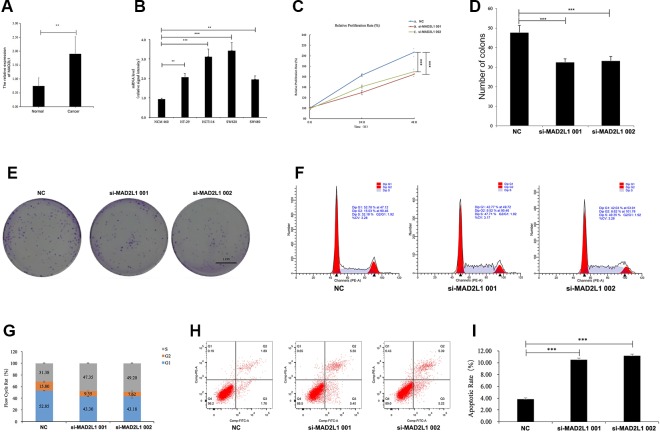
Figure 6.
MAD2L1 knockdown suppressed colon cancer cell proliferation by impairing cell cycle progression and inducing apoptosis. Notes: (A) Expression level of MAD2L1 gene in 20 paired CRC tissues (n = 3; **P < 0.01; two-tailed t-test). (B) Expression level of MAD2L1 gene in colon normal cell line NCM460 and CRC cell line HT-29, HCT116, SW620 and SW480 (n = 3; **P < 0.01, ***P < 0.001; two-tailed t-test). (C) The cell proliferation rate was analyzed by CCK-8 assay. All value were mean ± SD (n = 3; ***P < 0.001; two-tailed t-test). (D), (E) Colony formation assays were performed (n = 3; ***P < 0.001; two-tailed t-test). (F, G) Distribution of cells in three cell cycle phases was examined by flow cytometry assay, and the graph shows quantification for each phase. (H) For measurement of apoptotic cells, cells were stained with both AV and PI and analyzed by an image flow assay. (I) Graph illustrating the quantification of apoptotic cells (n = 3; ***P < 0.001; two-tailed t-test). Abbreviations: AV, Annexin V FITC; CCK-8, cell counting kit-8, PI, propidium iodide; NC, negative control.

