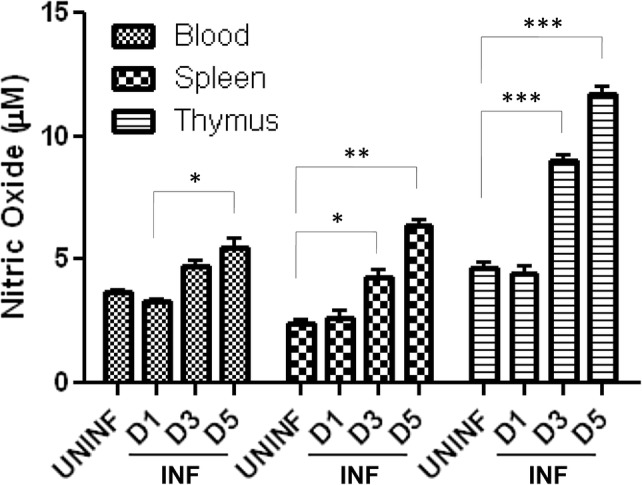
Fig. 4.

Effect of P. berghei infection on nitric oxide production in mouse tissue organs: values of NO (in µM)—derived from standard curve are presented as mean ± standard error of mean (UNINF—uninfected, INF—P. berghei infected) (*p < 0.05; **p < 0.01; ***p < 0.001) (two-way ANOVA) (D1, Day 1; D3, Day 3; D5, Day 5)
