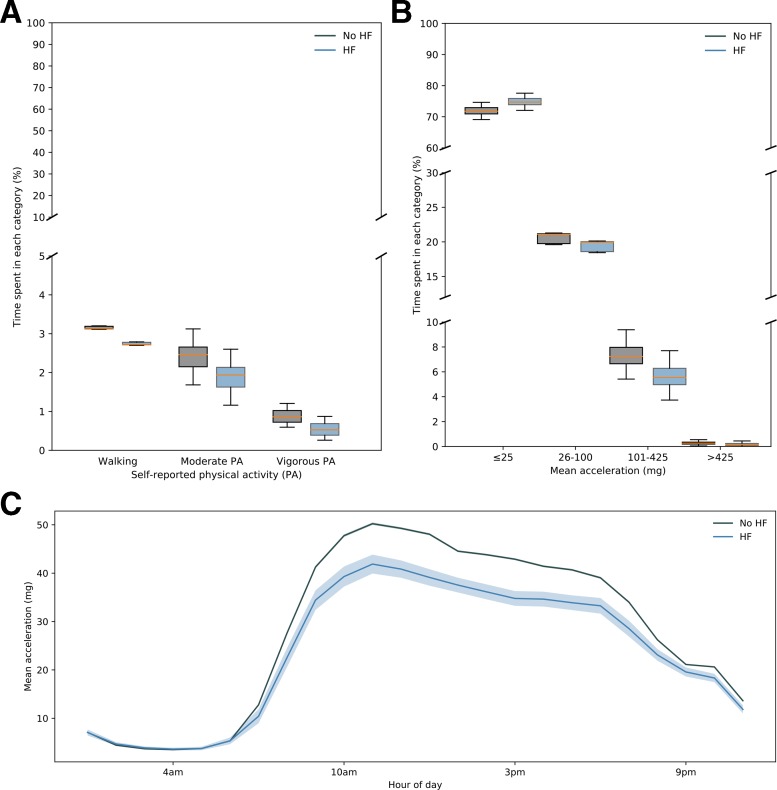
Figure 1.
Summary of self-reported and accelerometer-derived PA behaviours in participants with or without HF. (A) Box plots of percentage time spent within different categories of mean age-adjusted/sex-adjusted self-reported PA among participants with (blue) or without (grey) diagnosed HF. All differences are significant (p<0.01). (B) Box plots of percentage time spent within different mean age-adjusted/sex-adjusted acceleration ranges for participants with (blue) and without (grey) diagnosed HF. All differences are significant (p<0.01). (C) Mean (solid line) and CIs (shaded area) of mean acceleration during different hours of the dayfor participants with (blue) and without (grey) diagnosed HF. HF, heart failure; PA, physical activity.

