Fig. (11).

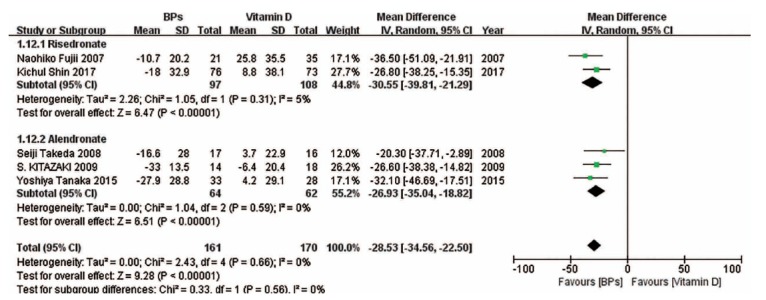
The forest plot of the subgroup analysis for the change in BAP between BPs and vitamin D. The BAP levels associated with risedronate and alendronate were statistically higher than those associated with vitamin D.

The forest plot of the subgroup analysis for the change in BAP between BPs and vitamin D. The BAP levels associated with risedronate and alendronate were statistically higher than those associated with vitamin D.