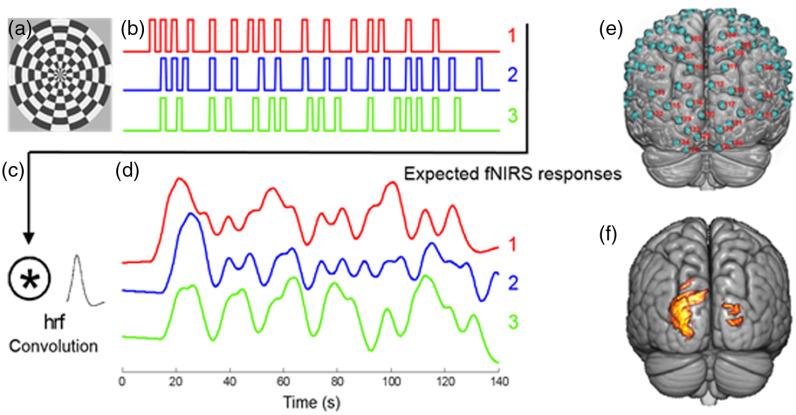
Fig. 1.
(a) The reversing checkerboard stimulus pattern subtended 15 degrees of visual angle. (b) The three stimulation sequences: 1, 2, and 3. Each vertical bar represents a two-second event during which the rate of reversal was 200 ms. The checkerboard was stationary during the interevent intervals. Approximately 16 events occurred during a 2-min run for all sequences. (c) The hemodynamic response function was convolved with each stimulation sequence. (d) The expected fNIRS responses for each sequence. (e) The channels (green circles) that cover the posterior part of the brain (occipital lobe) are identified by the red numbers and represent locations of detected hemodynamic signals. (f) The group analysis for 15 subjects combining all the sequences and both oxy- and deoxyhemoglobin spatially filtered signals are indicated by the clusters on the rendered brain ().

