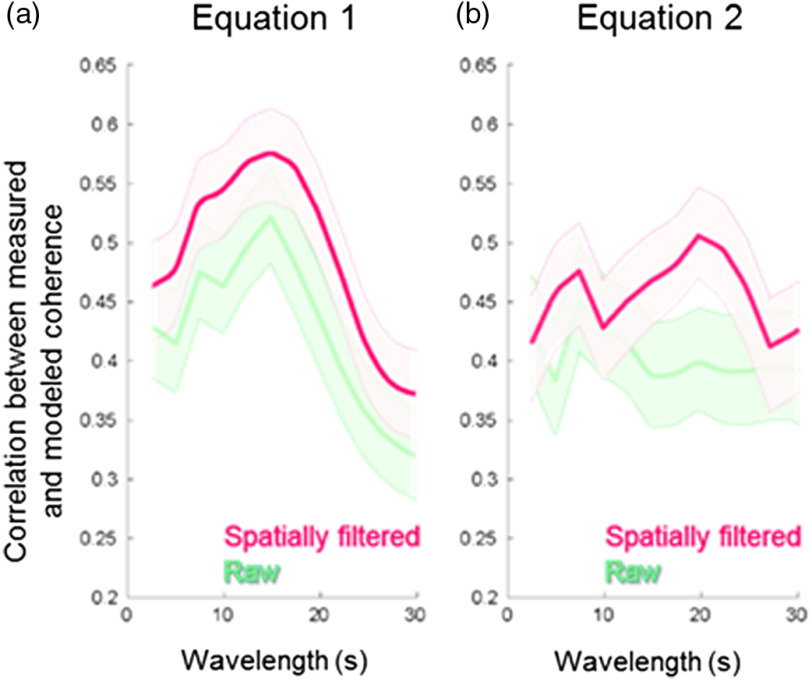
Fig. 4.
Correlation between the measured coherence from the visual ROI and the expected coherence using the combined fNIRS signals. Red functions show results from signals that have been filtered to remove the global mean. Green functions show results from the “raw,” unprocessed signals. (a) Coherence calculated with Eq. (1) and (b) coherence calculated with Eq. (2).

