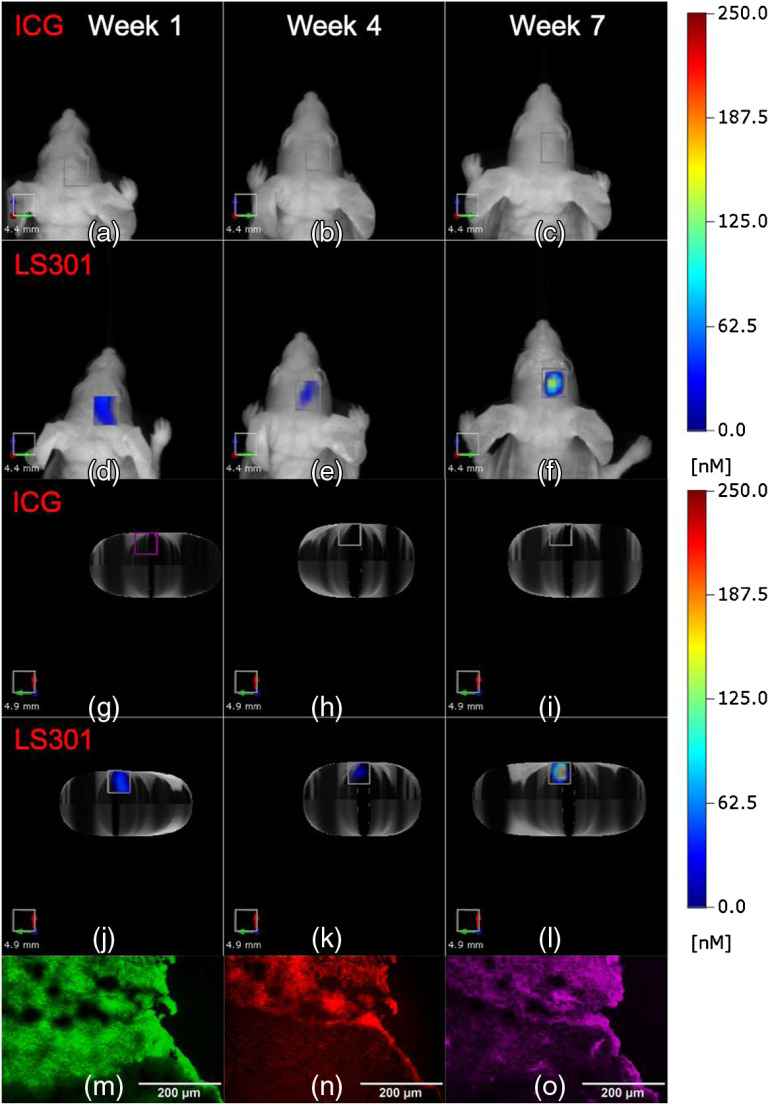
Fig. 2.
Comparison of (a)–(c), (g)–(i) ICG and (d)–(f), (j)–(l) LS301 uptake in tumor-bearing mice imaged at 24 h postinjection on weeks 1, 4, and 7 after tumor initiation. (a)–(f) Coronal projections of images with the corresponding axial projection images in (g)–(l) viewed head first for improved visualization. Epifluorescence microscopy of U87-GL PDE7B H217Q tumors harvested at 72 h postinjection of LS301 at 7 weeks post-tumor implantation. (m) GFP fluorescence of tumors (green). (n) NIR fluorescence of brain tissue (red). (o) p-ANXA2 stain of the tumor (magenta).

