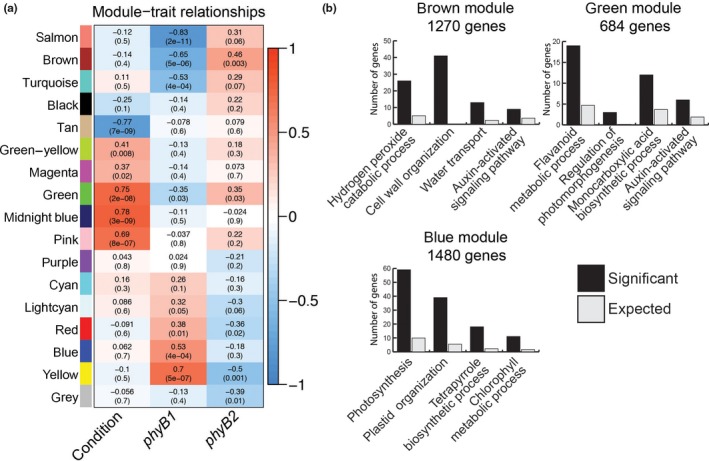
Figure 2.

Co‐expression modules show phyB1 and phyB2 differently regulate gene networks involved in auxin and photosynthesis related biological processes among others. (a) For each co‐expression module (indicated by color) and the genes that did not fall into a co‐expression module (gray), the average expression vector (eigenvector) across conditions and genotypes was correlated to condition (dark = 0, 60 min R exposure = 1) and genotype (phyB1 column: WT and phyB2 = 0, phyB1 = 1; phyB2 column: WT and phyB1 = 0, phyB2 = 1). R 2 values from the Pearson correlations are indicated in the heatmap by color according to scale on the right as well as by their printed value in the grid with p‐values below in parentheses. (b) Gene ontology functional enrichment analysis identified biological processes central to each co‐expression module. Displayed here are four enriched GO biological processes for the brown, green, and blue modules. The black bars represent the number of genes with that annotation in that group (Significant) and the gray bars represent the expected number of genes with that annotation if random (Expected)
