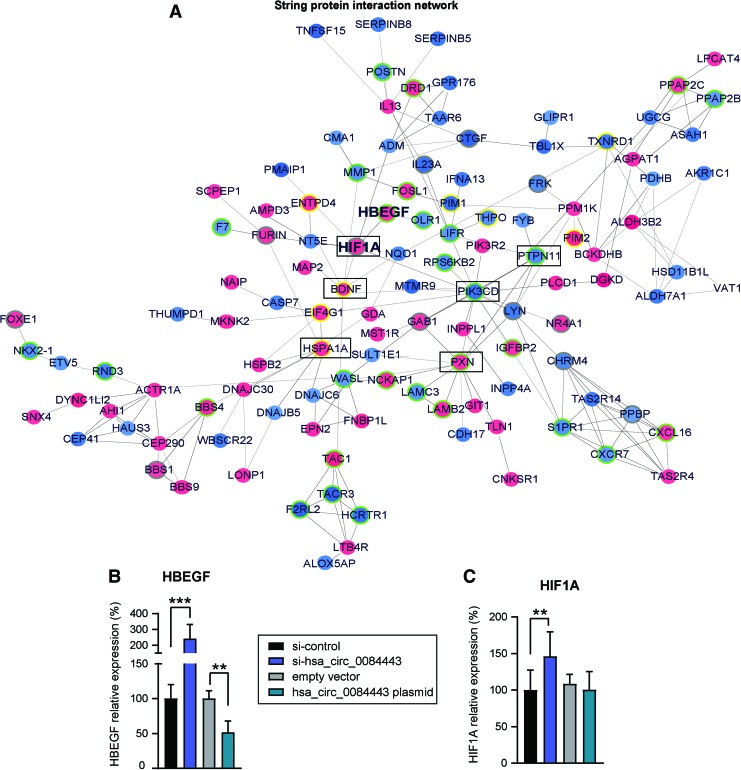
Figure 6.
A gene network regulated by hsa_circ_0084443 in keratinocytes. (A) Functional protein association network was identified by String APP in Cytoscape software among the genes regulated by hsa_circ_0084443 shown in the microarray analysis. Genes up- or downregulated after transfection of si-hsa_circ_0084443 are in red or blue, respectively. Genes previously reported to have an impact on cell migration and proliferation are highlighted: yellow border = proliferation genes, green border = migration genes, grey border = migration and proliferation genes. Core nodes identified by centrality analysis with the CentiScaPe 2.2 App are marked with black rectangles. qRT-PCR of HBEGF mRNA (B) and HIF1A mRNA (C) in keratinocytes with hsa_circ_0084443 knockdown (n = 10) or overexpression (n = 4). **p < 0.01 and ***p < 0.001 by unpaired two-tailed Student's t-test. Data are presented as mean + SD. Color images are available online.

