Figure 4.
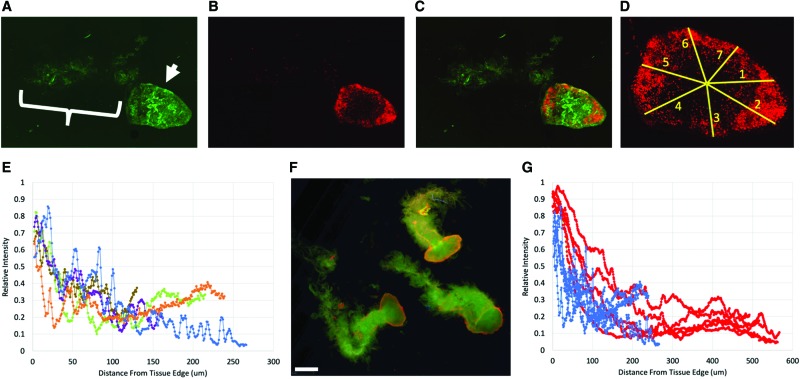
Representative image of LIVE/DEAD staining in MSTCs, after 24 h of incubation (the time point of conditioned media collection). Live cells stained with calcein AM (A, epidermis highlighted by arrow, dermis by bracket), dead cells with Propidium Iodide (B). Superimposed image with both stains shown in (C). (D) Example of linear region of interests (ROIs, labeled 1–7 in the image), each spanning the distance from the edge to the center of the epidermal surface of an MSTC, used to obtain Propidium Iodide staining intensity profiles. (E) Propidium iodide staining intensity (adjusted for baseline and normalized for dynamic range, as detailed in the text) as a function of distance from tissue edge. Each curve shows the average values from the linear ROIs for one MSTC, curves from five independent MSTCs are shown. Dead cells are predominantly located along the tissue periphery. (F) Live/Dead staining results in 19G MSTCs. Scale bar = 1 mm. (G) Propidium Iodide staining intensity as a function of distance from tissue edge, in 21G MSTCs (blue) and 19G MSTCs (red), n = 5 each. Overall, both sizes showed similar intensity profiles, with dead cells predominantly located along the tissue periphery. MSTC, micro skin tissue column; ROI, region of interest. Color images are available online.

