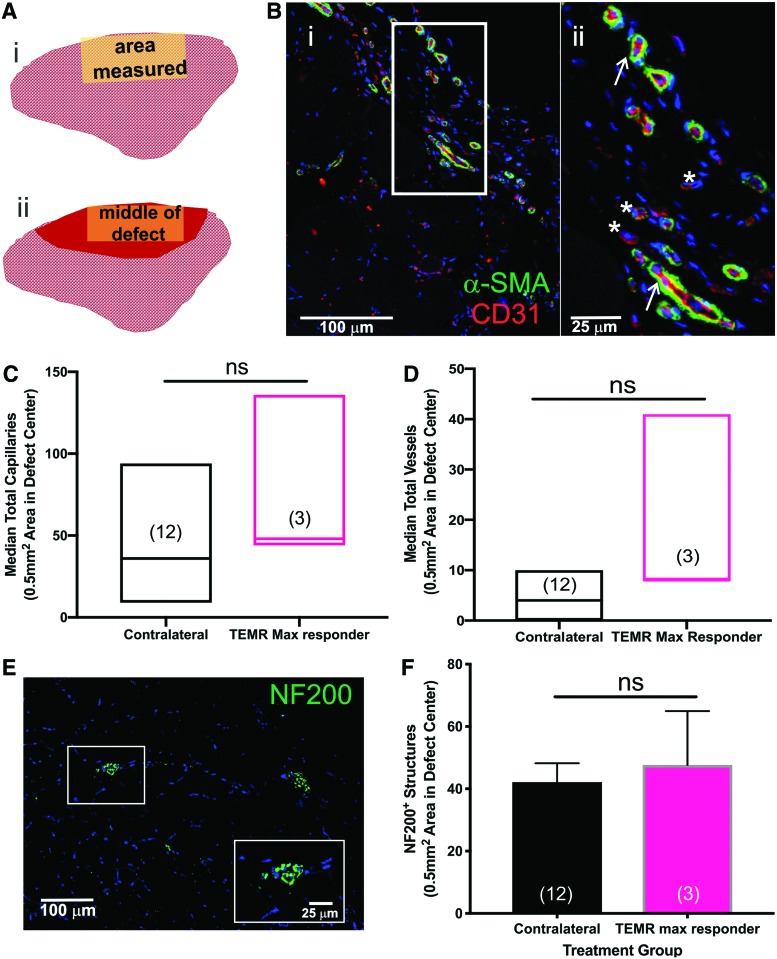
FIG. 7.
Comparison of vasculature and neuronal innervation in the TA muscle of the TEMR max responders. (A) Cross-sectional schematic of the TA indicating where IF measurements were made in the contralateral control muscles (A[i]), and in the TEMR max responder muscles (A[ii]). Red shading indicates the region in the cortex where nominal de novo muscle regeneration was observed at the site of the original defect. Representative capillary and vessel staining in the (B[i]) representative TEMR max responder TA. Sections were stained for α-SMA (smooth muscle cells) and CD31 (endothelial cells) and the number of capillaries (white asterisks) and vessels (white arrows) were manually counted in the same region of interest in each sample, as described in the section “Materials and Methods.” Representative staining is shown in a higher magnification inset (B[ii]) that corresponds to the outlined area shown in (B[i]). (C) Capillaries and (D) vessels were quantified. There were no statistically significant differences between TEMR max responders and the contralateral control TA muscles (p > 0.05, Mann–Whitney test). Because the data were not normally distributed, the values are expressed as the median ± range; sample sizes are in parentheses. (E) Representative neuron staining in the rat TEMR max responder muscle. Punctate dots were counted as occurrences of positive staining. The inset shows a higher magnification of NF200 staining. (F) TEMR max responders had levels of innervation comparable to the native contralateral controls (by unpaired t-test, ns = not significant, p = 0.7). Values are expressed as the mean ± SEM; sample sizes are in parentheses. IF, immunofluorescence; SMA, smooth muscle actin. Color images are available online.

