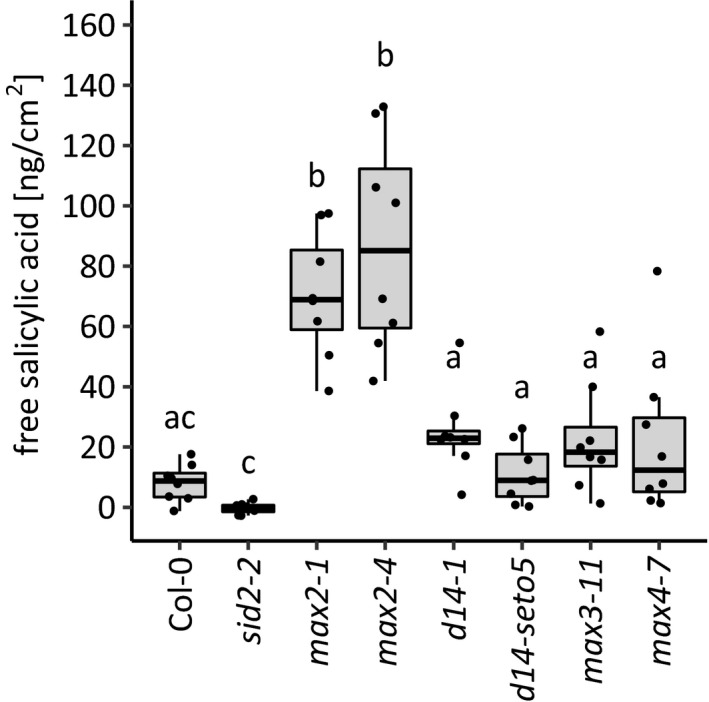
Figure 2.

Accumulation of free salicylic acid in response to Pseudomonas syringae DC3000. Wild‐type (Col‐0), strigolactone signaling mutants (max2‐1, max2‐4, d14‐1 and d14‐seto5) and strigolactone biosynthesis mutants (max3 and max4) were infected with P. syringae (OD600 = 0.2) by spraying. SA was measured using a biosensor‐based method based on the protocol by DeFraia et al., (2008). Salicylic acid biosynthesis mutant (sid2‐2) was included as a control for accumulation of free salicylic acid. Salicylic acid accumulation was measured 27 hr postinoculation. Each dot represents one plant. In total, seven to eight plants were used per line. The experiment was performed three times with similar results. Box plots are summarizing data by showing the median, and first and third quartiles. Whiskers are extending to a maximum of 1.5 × interquartile range beyond the box. Different letters indicate significant differences (p < .05) as determined by Kruskal–Wallis rank sum test followed by pairwise Wilcoxon rank sum tests with multiple testing correction to p‐values using Holm method
