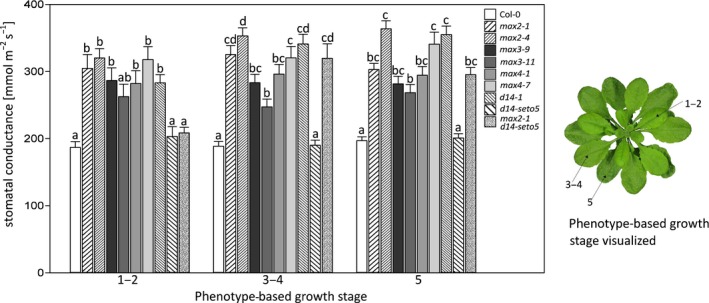
Figure 6.

The stomatal conductance of strigolactone biosynthesis and perception mutants measured with a porometer from leaves of different developmental stages. The error bars represent standard error of the mean. 2–3 leaves per each growth stage was measured from each plant, and altogether, a minimum 20 plants were measured from each plant line. The phenotype‐based growth stage is determined in the article by Boyes et al., (2001) in which numbers indicate the growth stage: 1 indicates leaf production, 3 rosette growth, and 5 inflorescence emergence. We used the plants for analysis before they reached the stage 5.10 (i.e., before the first flower buds were visible). In statistical analysis, we conducted a logarithmic transformation on the data and then univariate analysis of variance combined to Tukey HSD post hoc test
